Atmospheric Pressure
by Ghost Aviator
Table of Contents
- Static and Dynamic Pressure
- Pressure as Weight of Air Above
- Vertical Variation of Pressure
- Variation of Pressure – Warm vs Cold Air
- Semi-Diurnal Variation of Pressure
- Measurement Instruments
- Altimeter Correction (Alticor / D Value)
- Contours, Thickness and Pressure Gradient
- Pressure Tendency and Isallobars
- Altimetry — Definitions
- Pressure Settings (QFE, QFF, QNH, QNE)
- Relation between QNH, QFE and QNE
- Under-Reading / Over-Reading
- Pressure Patterns
- Practice Q&A (41 Questions)
- Master Reference Tables
1. Static and Dynamic Pressure
When air is in motion, an additional pressure is exerted in the direction opposite to the flow. This additional component is called Dynamic Pressure or Wind Pressure.
2. Pressure as Weight of Air Above
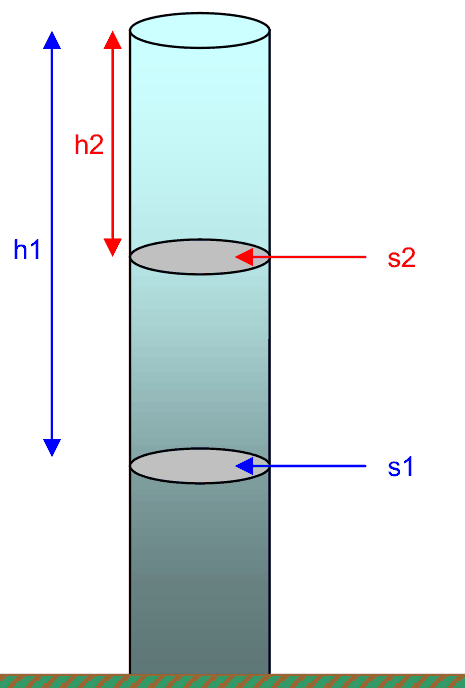
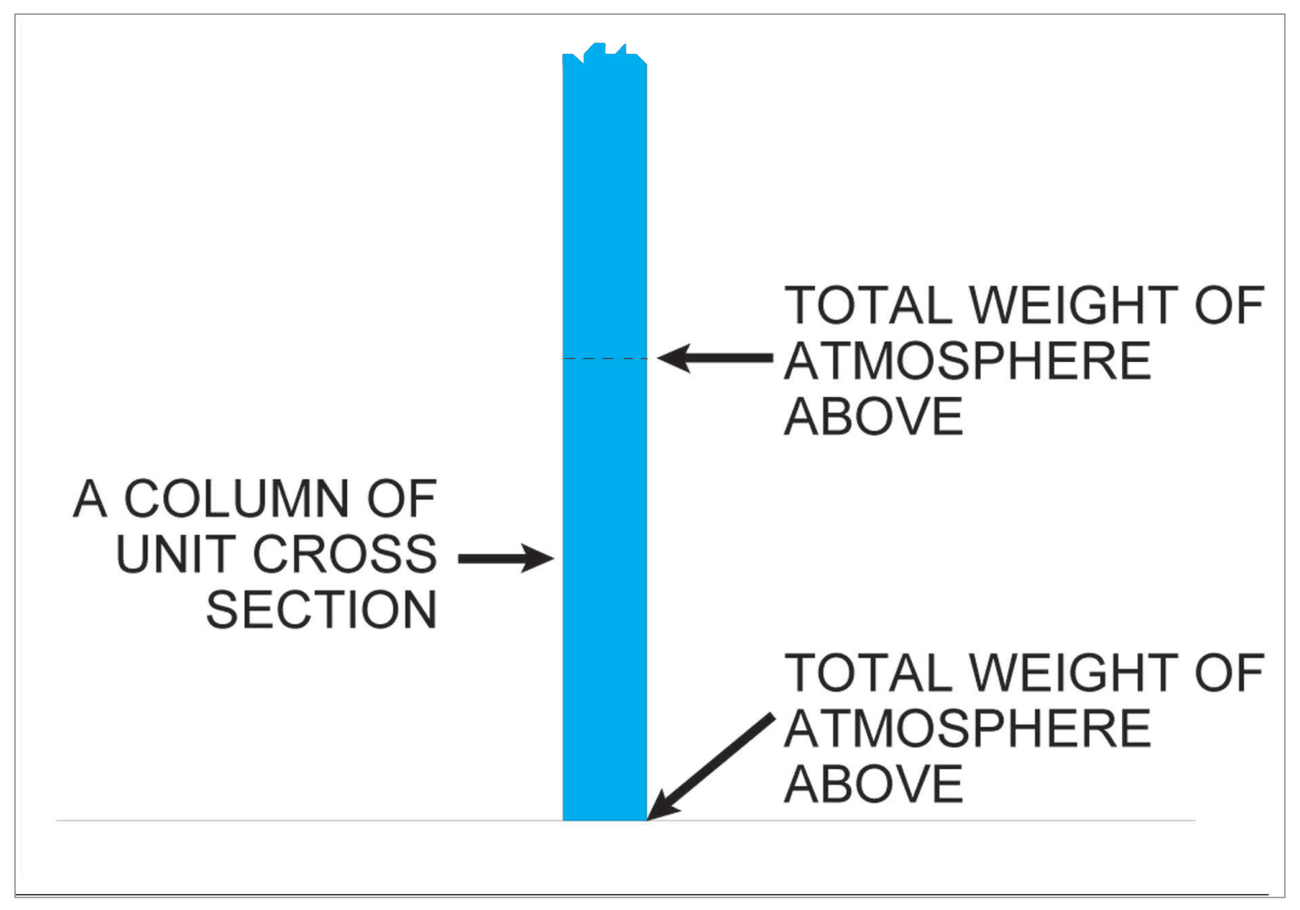
The atmospheric pressure at any level is the weight of the column of air of unit cross-section extending vertically to the top of the atmosphere. As the amount of air in the column decreases with height, the pressure also decreases with height.
1 hPa = 1000 dyn/cm²
Unit of force is Newton (N).
Standard Sea Level Pressure:
1013.25 hPa = 760 mm = 29.92 in
Also called 1 Bar = 100,000 N/m²
1 Bar = 1000 mb (millibars) = 1000 hPa
Heecto = 100; so 1 hPa = 100 Pa
Multiply hPa value by 0.02953
3. Vertical Variation of Pressure
The pressure decreases with height at a decreasing rate:
| Height Range | Rate of Decrease per 100 m |
|---|---|
| Sea level to 600 m | 4% |
| Up to 1.5 km | 3% |
| Up to 3 km | 2.5% |
| At 6 km | Reduces to half the sea level value |
| At 100 km | Negligible — regarded as vacuum |
Height Difference with 1 hPa Change
Height difference = 96 × T / p feet
(where T = temperature in Kelvin, p = pressure in hPa)
At 1000 hPa, T = 300 K:
Height = 96 × 300 / 1000 = 28.8 ft
In ISA conditions, 1 hPa pressure change corresponds to approximately:
| Level | MSL | 2,000 ft | 20,000 ft | 40,000 ft |
|---|---|---|---|---|
| Height equivalent | 27 ft | 30 ft | 50 ft | 100 ft |
• If air is warmer than ISA → height change for 1 hPa will be MORE than above values
• If air is colder than ISA → height change will be LESS than above values
4. Variation of Pressure – Warm vs Cold Air
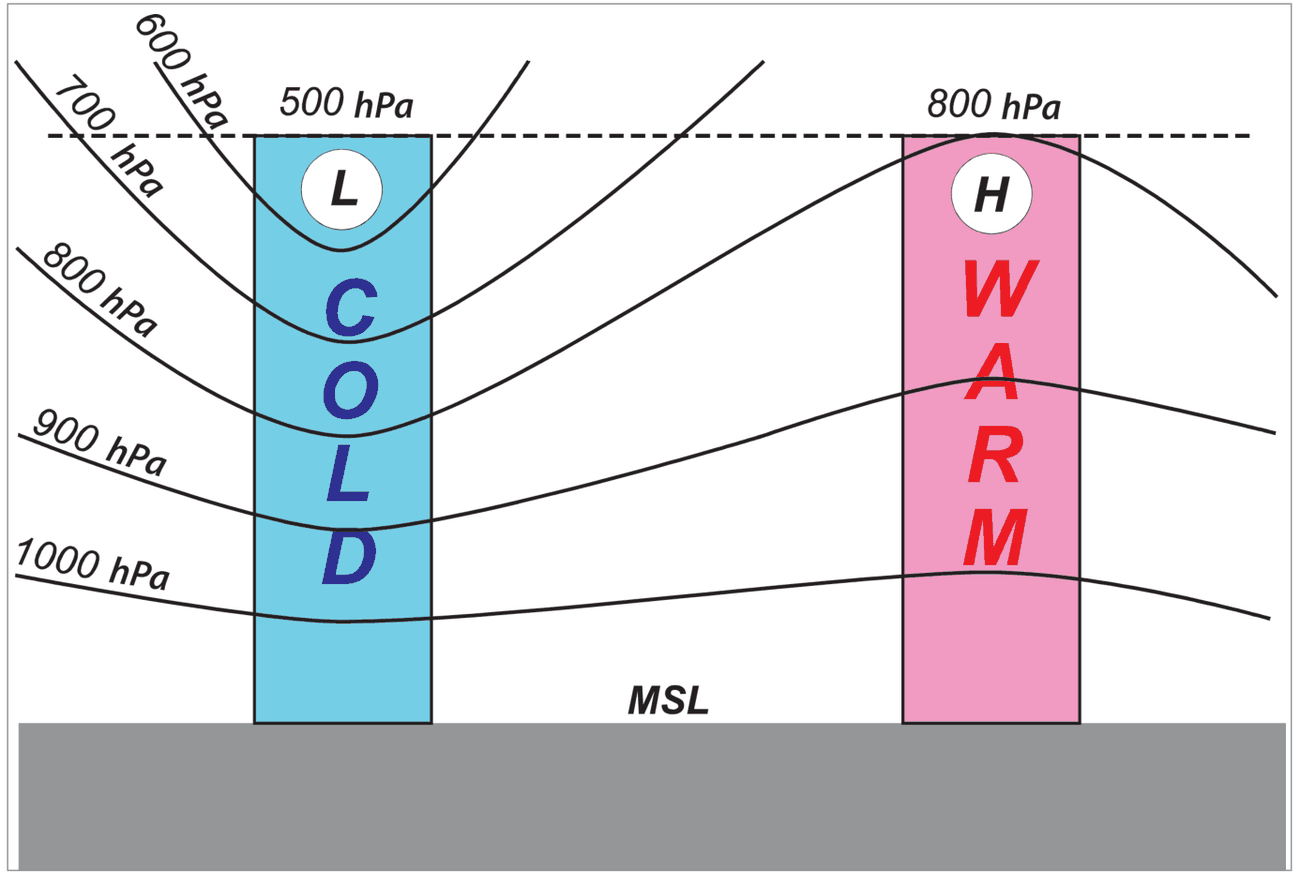
Cold air is denser than warm air. Pressure falls at a faster pace over a cold column of air than over a warm column.
Key Rule: Pressure at any given height will be higher over warm air than over cold air.
• Isobars Dip going from High to Low pressure
• Isobars Rise going from Low to High pressure
• Isobar = line joining places of equal pressure
5. Semi-Diurnal Variation of Pressure
• Maxima: 1000 hr and 2200 hr (local time)
• Minima: 0400 hr and 1600 hr (local time)
This semi-diurnal variation is due to solar influence.
Variations are: very small at the Poles and about 3–5 hPa at the Equator.
This is probably a natural oscillation of the atmosphere with a period of almost 12 hours.
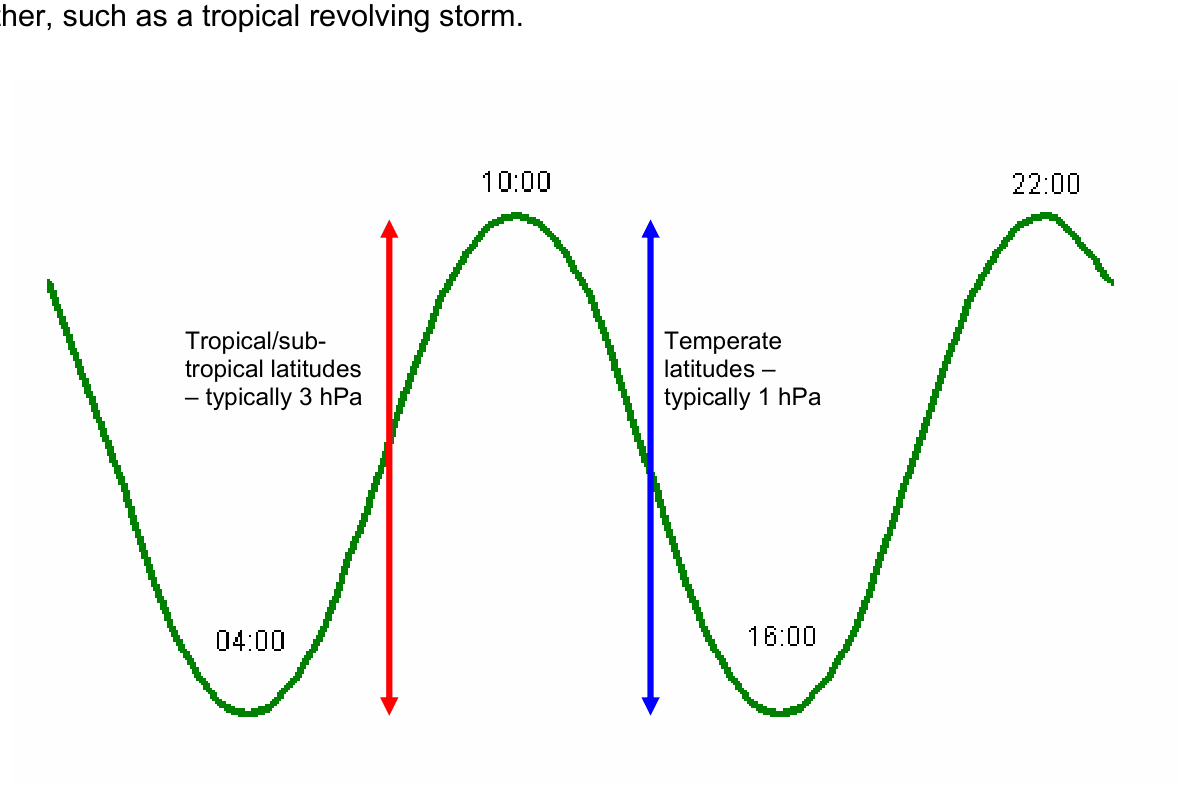
Min at 0400 (4 AM) and 1600 (4 PM). Remember: pressure is lowest in early morning and late afternoon.
6. Measurement Instruments
| Instrument | Type | Description |
|---|---|---|
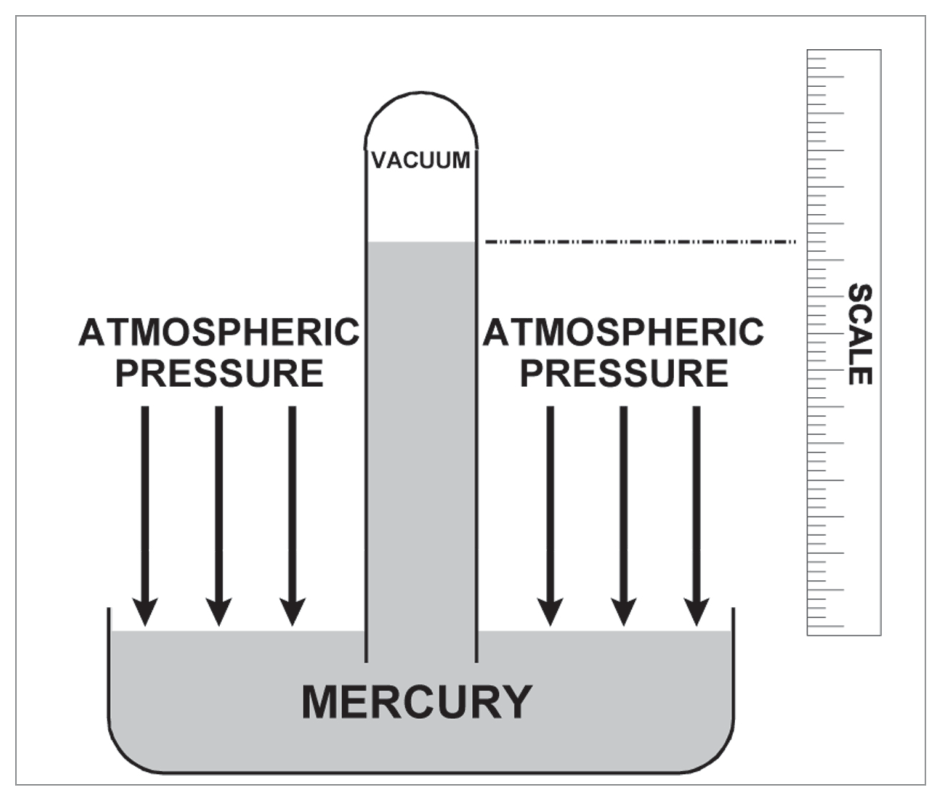
| Mercury Barometer | Accurate | Atmospheric pressure balanced by height of mercury column |
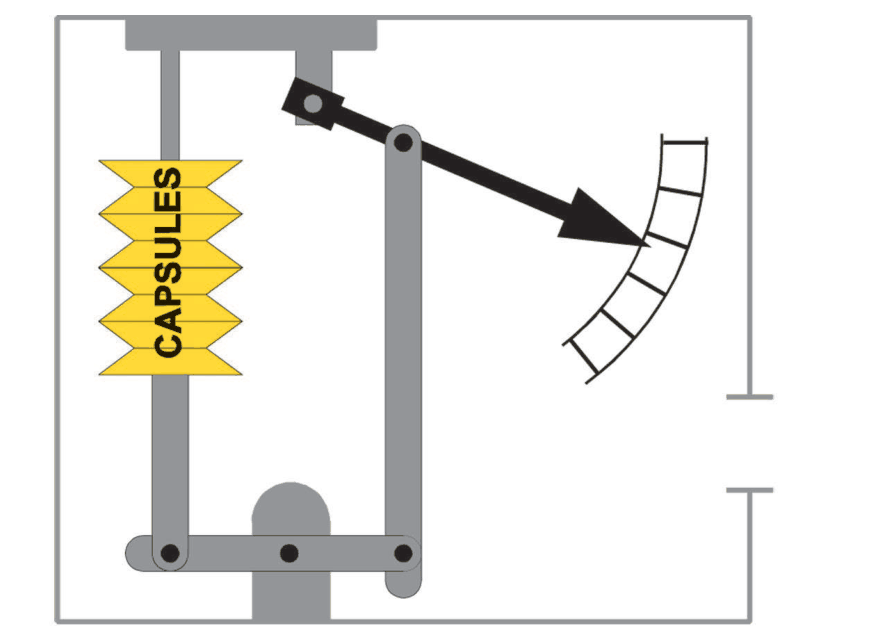
| Aneroid Barometer | Practical | Uses metal capsule; not as accurate as mercury; scale graduated in pressure (replaces mercury for ease of handling) |
| Altimeter | Aneroid type | Aneroid barometer with scale graduated in altitude instead of pressure; can be set to desired pressure value |
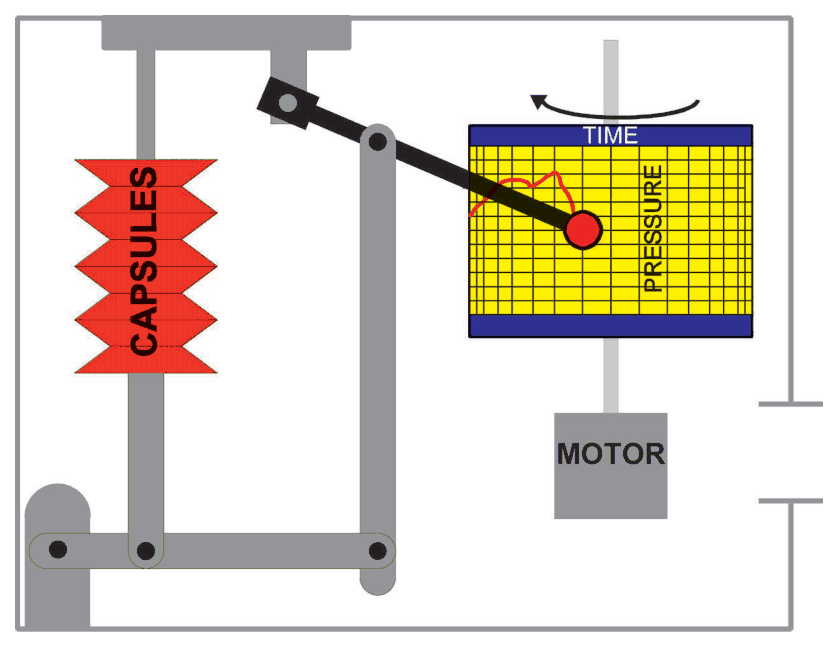
| Barograph | Recording | Continuously records pressure; can be Daily Barograph or Weekly Barograph |
7. Altimeter Correction (Alticor / D Value)
This is frequently required for mountain flying and bombing operations.
D Value = True Altitude − Indicated Altitude
Correction to obtain true altitude = True Altitude − Indicated Altitude
D Value decreases when aircraft flies from High to Low pressure.
Rough Calculations of Alticor
Add 30 ft for every 1 hPa when MSL pressure is higher than 1013.2 hPa
Subtract 30 ft per 1 hPa when MSL pressure is lower than 1013.2 hPa
(b) Temperature Correction:
Add 1% of indicated altitude for every 3°C temperature is higher than ISA
Subtract 1% per 3°C when temperature is lower than ISA
(c) Add these algebraically for final correction.
High to Low → Over Read (altimeter reads High = dangerous, you're lower than indicated)
Low to High → Under Read (altimeter reads Low; this alone does not establish terrain clearance)
Warm to Cold → Over Read | Cold to Warm → Under Read
If QNH is High → True Alt will be High
8. Contours, Thickness and Pressure Gradient
Contours
In Contour Charts, contours are drawn at an interval of 40 gpm (geopotential metre) in 700 hPa and 500 hPa level charts; and at 80 gpm in 300 hPa and 200 hPa level charts.
1 gpm = 9.8 J/kg (gravitational potential energy per unit mass).
Contour lines numbered in geopotential decametres, e.g. 5280 gpm = 528.
A geopotential height of 700 gpm is approximately 700 m. A chart label 700 in geopotential decametres represents 7000 gpm; always check the chart units.
Centres of Low and High are marked as in surface pressure charts.
Thickness
The height interval between the lower and upper level is called Thickness. Low thickness = lower mean temperature; High thickness = higher mean temperature. The isopleths of thickness coincide with the isotherms of mean temperature of the layer.
Pressure Gradient
• Isobar = line joining places of equal pressure.
• Steep pressure gradient → isobars are close together → strong winds.
• Flat/weak gradient → isobars far apart → light winds.
9. Pressure Tendency and Isallobars
Isallobars = lines joining places of equal pressure change. At a glance, isallobars indicate areas of rising or falling pressure tendency.
• Isallobaric Low = region of greatest fall enclosed by isallobars.
• Isallobaric High = region of highest rise.
Surface Lows tend to move towards Isallobaric Low.
Isallobaric High indicates weakening of a pressure system.
10. Altimetry — Definitions
| Term | Definition |
|---|---|
| Mean Sea Level (MSL) | A reference level taking average of high and low tides. |
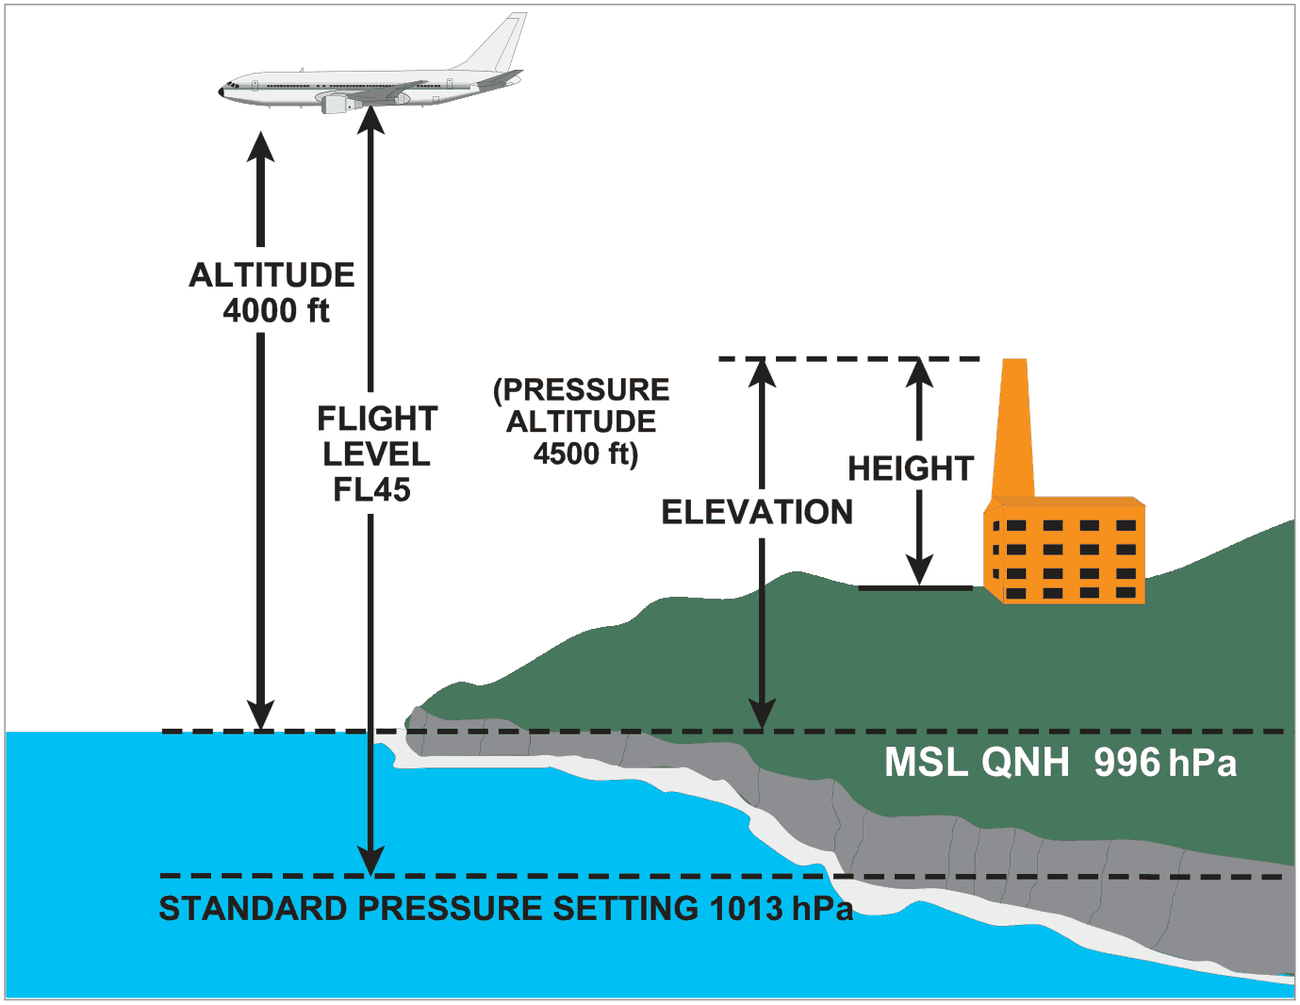
| Altitude | Vertical distance from MSL. |
| Height | Vertical distance from a specific datum (e.g., from the ground). |
| Elevation | Vertical distance of a point or level on the surface of the earth from MSL. |
| Transition Altitude (TA) | Highest altitude below which aircraft always fly on local QNH. Vertical position controlled with reference to height above aerodrome. |
| Transition Level (TL) | Lowest Flight Level above which aircraft always fly on standard QNH 1013.25 hPa. Above TL, vertical position expressed in hundreds of feet. |
| Transition Layer | The airspace between Transition Altitude (TA) and Transition Level (TL). |
| Flight Level (FL) | Levels of constant pressure at or above TL, separated by pressure intervals corresponding to MSL pressure. E.g., FL50 = 5,000 ft, FL300 = 30,000 ft, FL200 = 20,000 ft. |
| Pressure Altitude | When the altimeter sub-scale is set to 1013.2 hPa, the altimeter indicates Pressure Altitude. Expressed as FL35, FL190, FL400 (avoid last two zeros). |
11. Pressure Settings
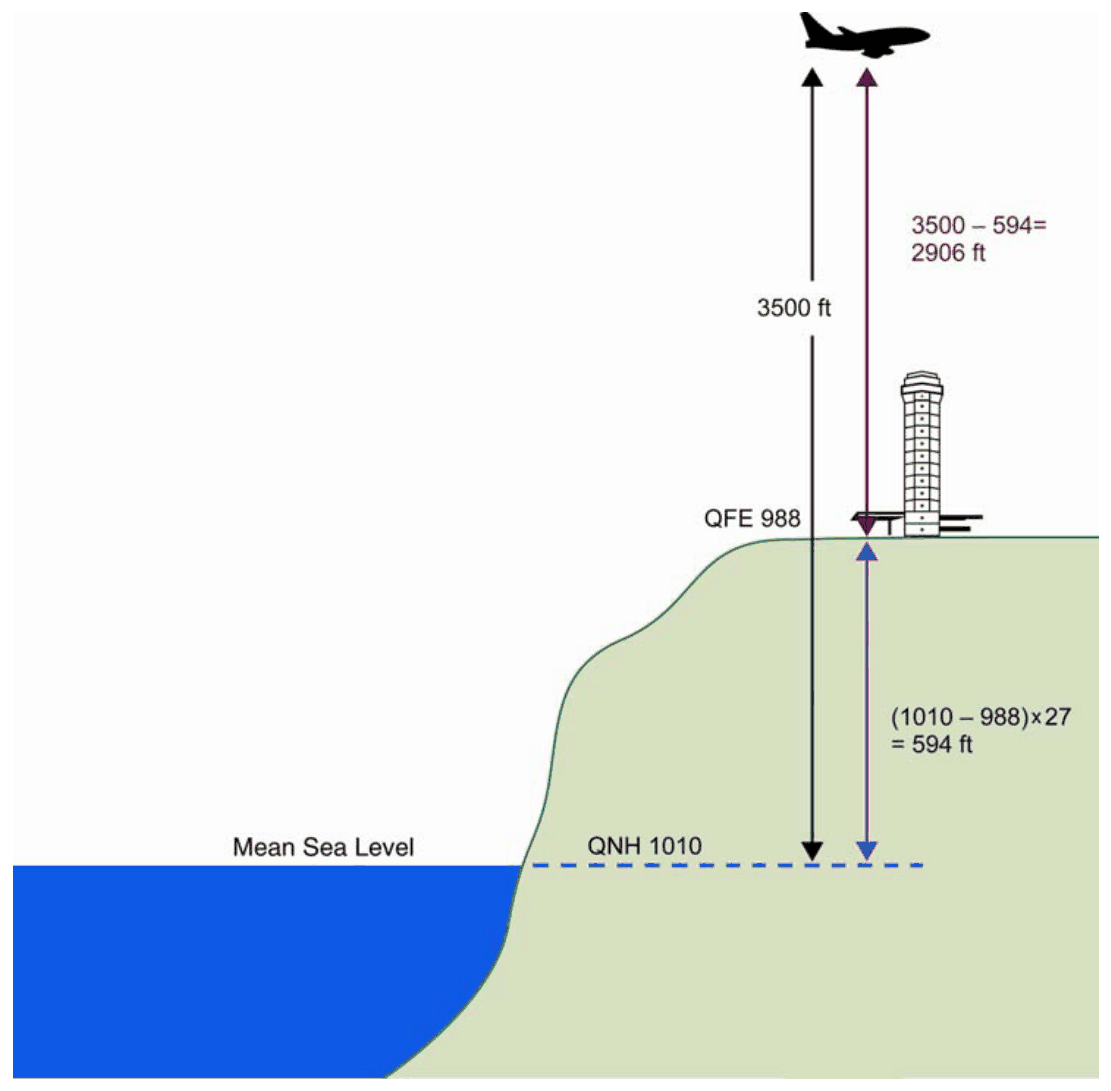
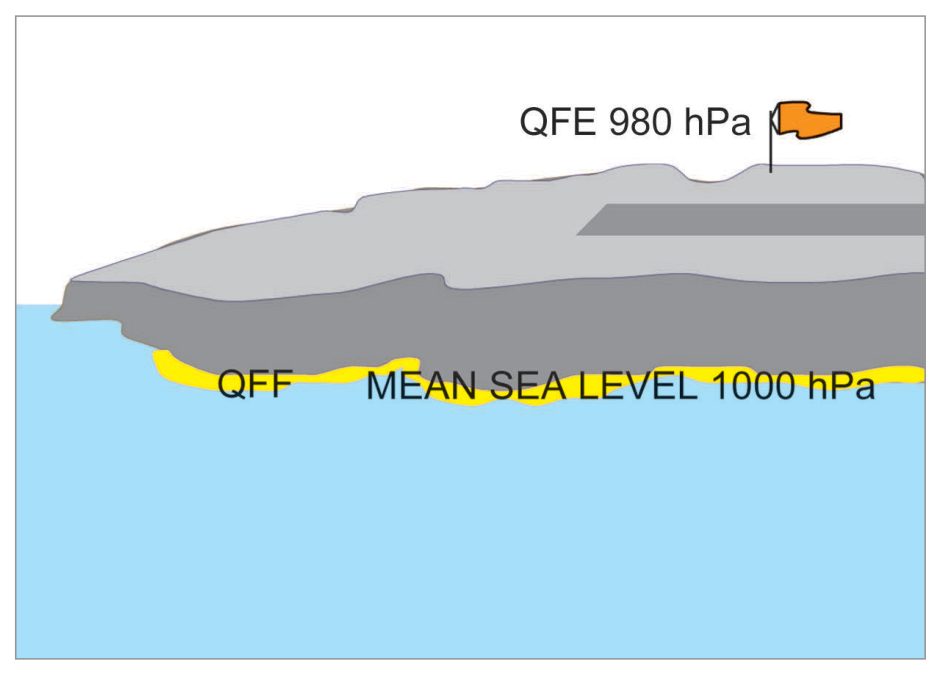
Pressure settings: QFE, QFF and QNH
| Setting | Definition | Use |
|---|---|---|
| QFE | Pressure at the specified aerodrome or runway pressure datum. With QFE set, the altimeter reads approximately zero at that datum. | Height above aerodrome |
| QFF | Barometric pressure of aerodrome reduced to MSL using the actual temperature of the place (column of air extending up to MSL). | Plotting synoptic charts and drawing isobars |
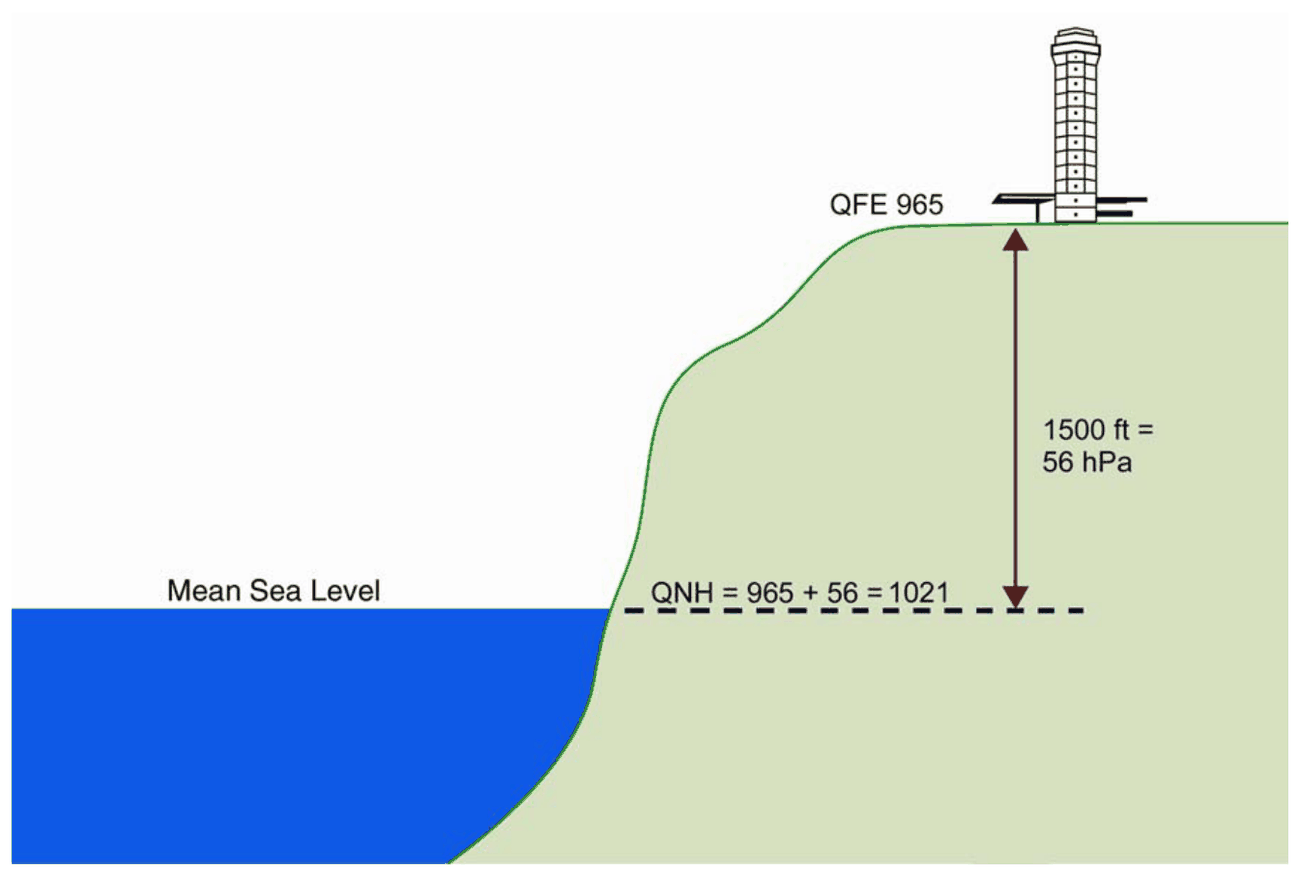
| QNH | Station pressure reduced to mean sea level using the standard atmosphere. With QNH set, the altimeter reads the aerodrome elevation at its datum. Absolute altitude means height above ground and is a different quantity. | Vertical separation of aircraft and terrain |
| Regional QNH | Forecast value of the lowest pressure expected in an Altimeter Setting Region (ASR). Issued every hour, valid for one hour. | Ensuring adequate terrain clearance |
| QNE | Altitude indicated when sub-scale set to 1013.25 hPa (29.92 in). Used for high altitude airfields. | High altitude airfields; Pressure Altitude reference |
12. Relation between QNH, QFE and QNE
QFE = 950 hPa, QNH = 1000 hPa, 1 hPa = 30 ft
Elevation = (QNH − QFE) × 30 = (1000 − 950) × 30 = 50 × 30 = 1500 ft
Station level would be = (QNE − QFE) × 30 ft = (63 hPa) × 30 = 1890 ft
Station elevation = (QNH − QFE) × 30 = (50 hPa) × 30 = 1500 ft
270 / 27 = 10 hPa → QNH = 1000 + 10 = 1010 hPa
Height difference = 700 − 400 = 300 ft = 300/27 = 11 hPa
QNH at B = 1010 − 11 = 999 hPa
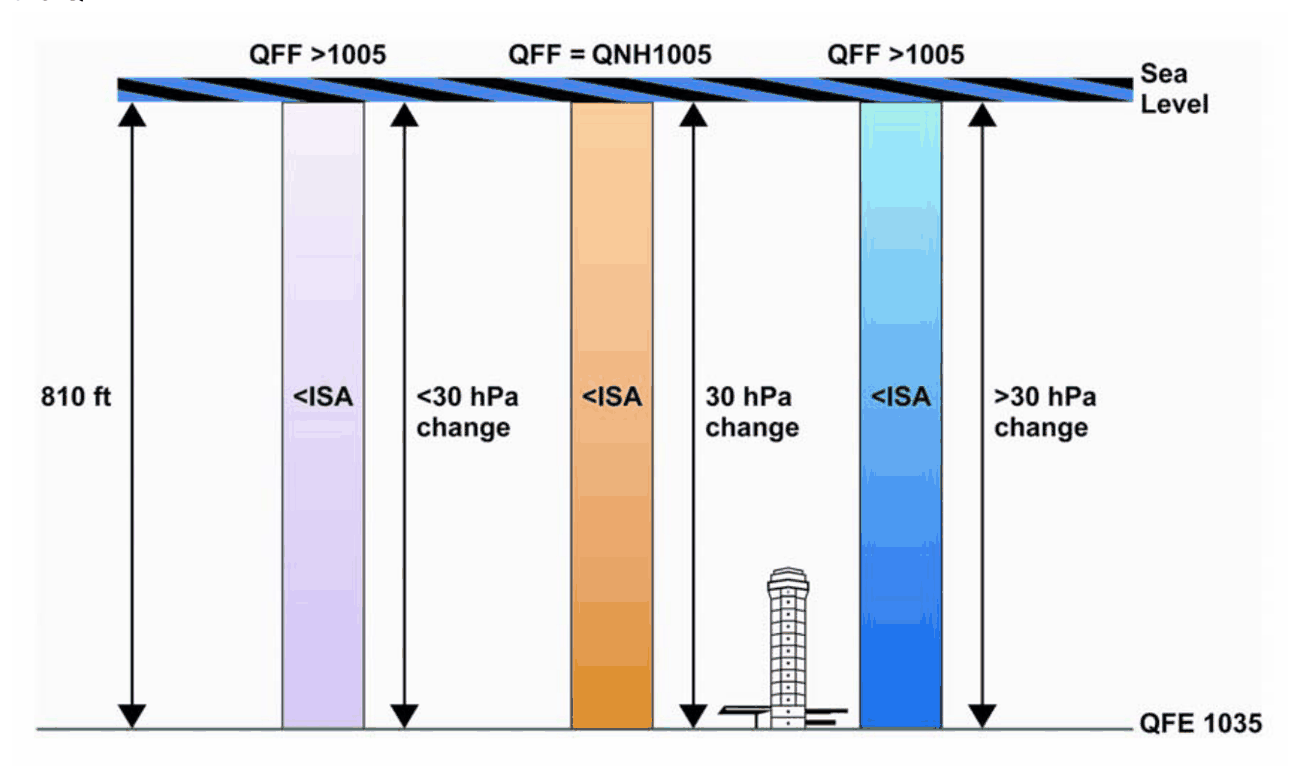
L-H-L Rule for QNH/QFE Relationship
At MSL: QFF = QNH
Pressure set on altimeter < QNH → Indicated Altitude < True Altitude
Pressure set on altimeter > QNH → Indicated Altitude > True Altitude
Standard Isobaric Levels
Corresponding to ISA pressure, the Pressure Altitude (Ft) and Flight Levels are:
| Level (hPa) | 850 | 700 | 500 | 400 | 300 | 200 | 100 |
|---|---|---|---|---|---|---|---|
| Pressure Altitude (ft) | 5,000 | 10,000 | 18,000 | 24,000 | 30,000 | 38,000 | 53,000 |
| Flight Level | FL50 | FL100 | FL180 | FL240 | FL300 | FL380 | FL530 |
13. Under-Reading / Over-Reading
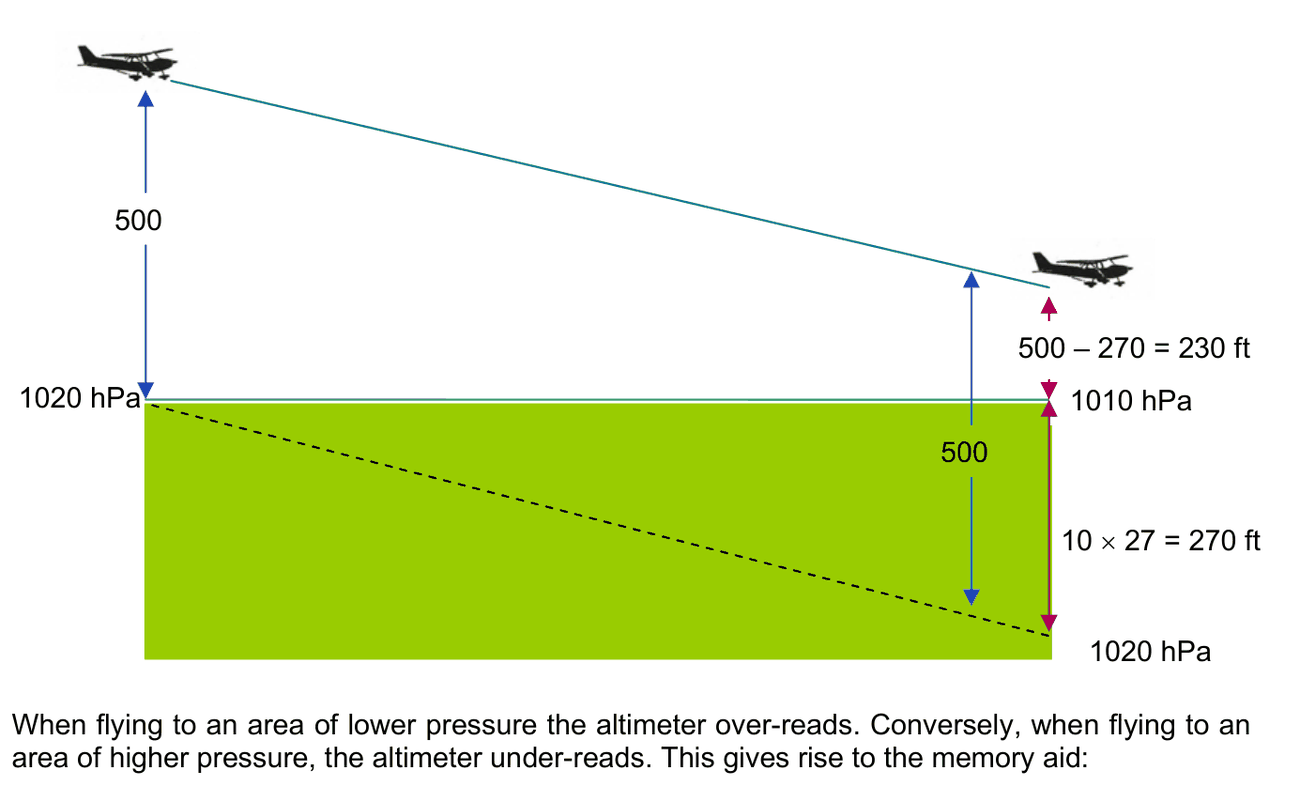
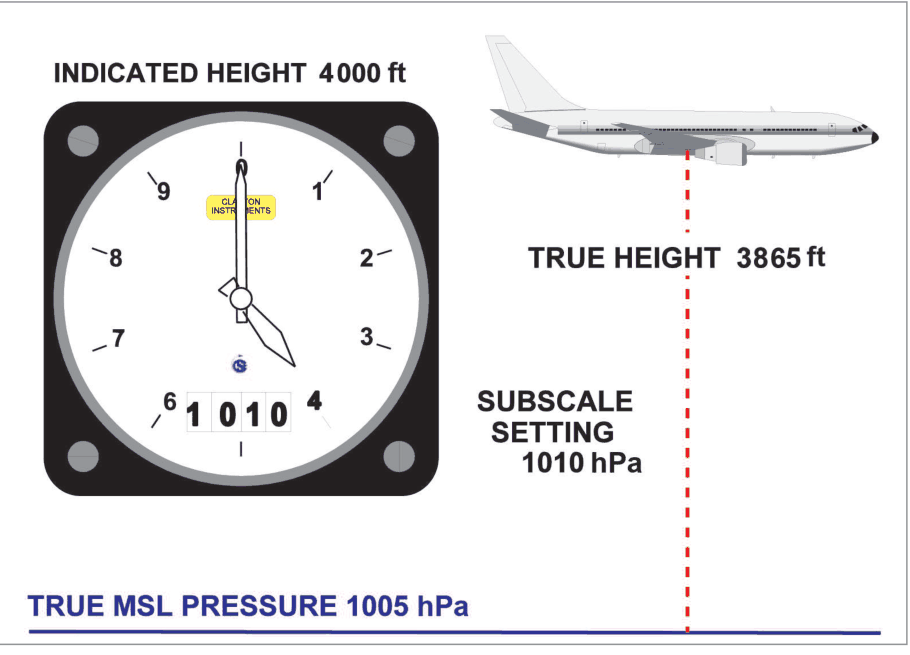
High to Low → Over Read
Warm to Cold → Over Read
If QNH is High → True Alt is High
Altimeter reads too high — you are lower than indicated!
Low to High → Under Read
Cold to Warm → Under Read
Altimeter Setting is Low → Indicated Alt will be Low
You are higher than indicated for this pressure-error comparison. Terrain clearance still requires the correct setting and other applicable corrections.
14. Pressure Patterns
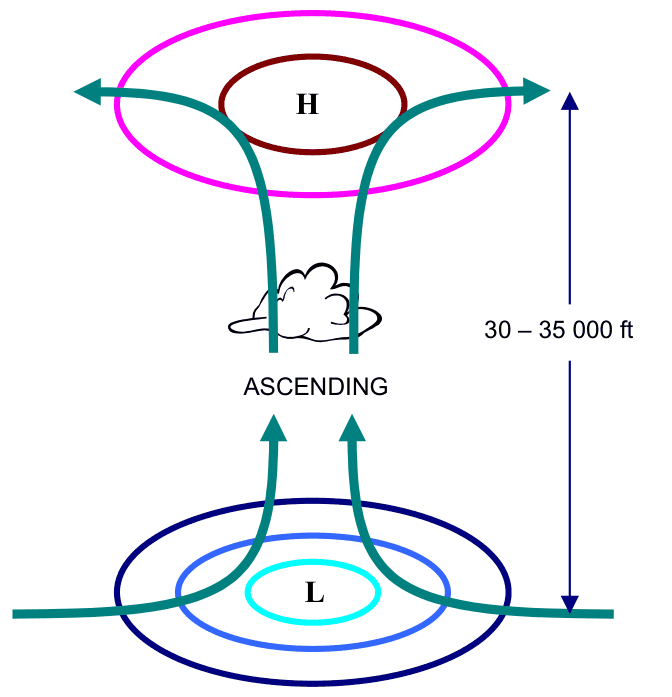
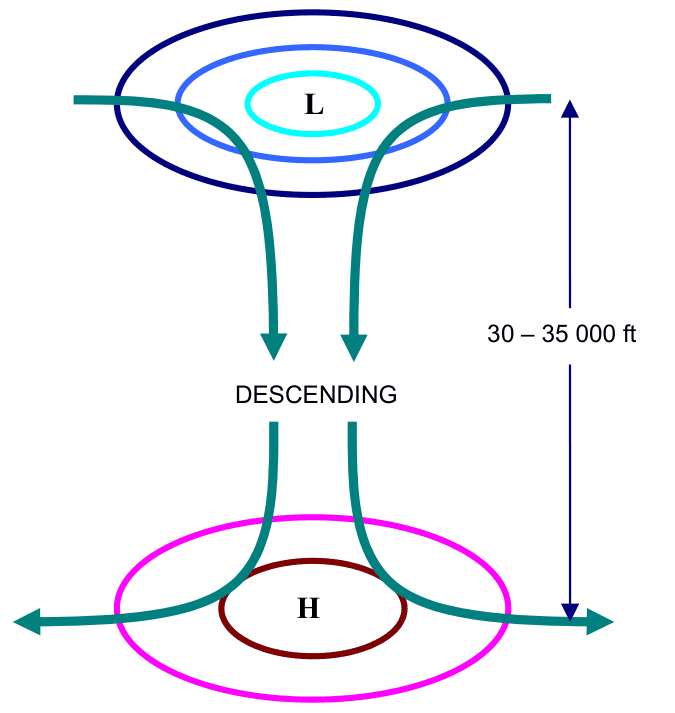
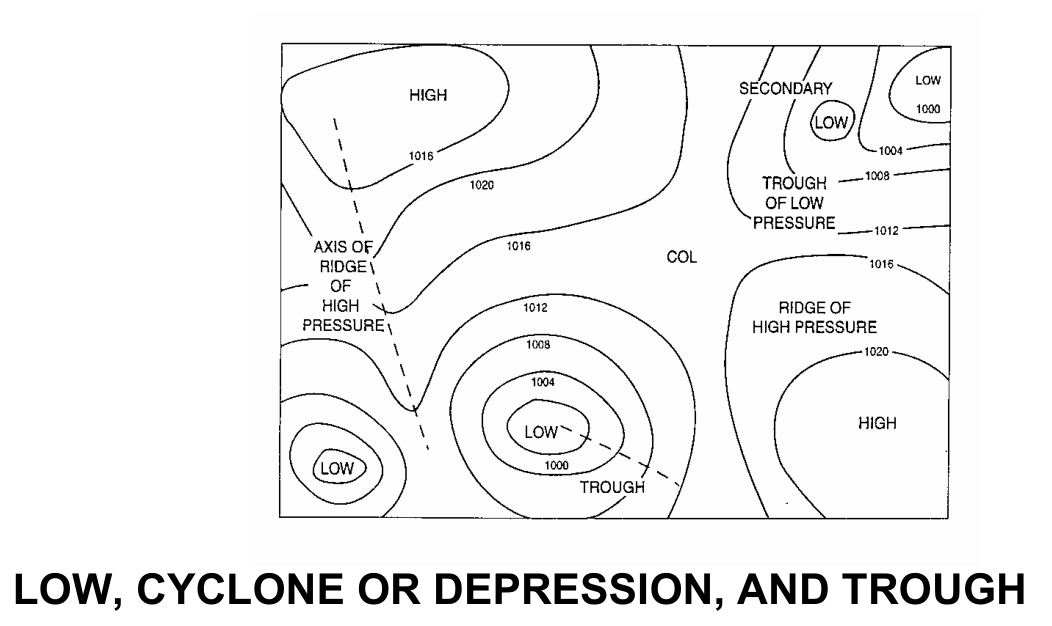
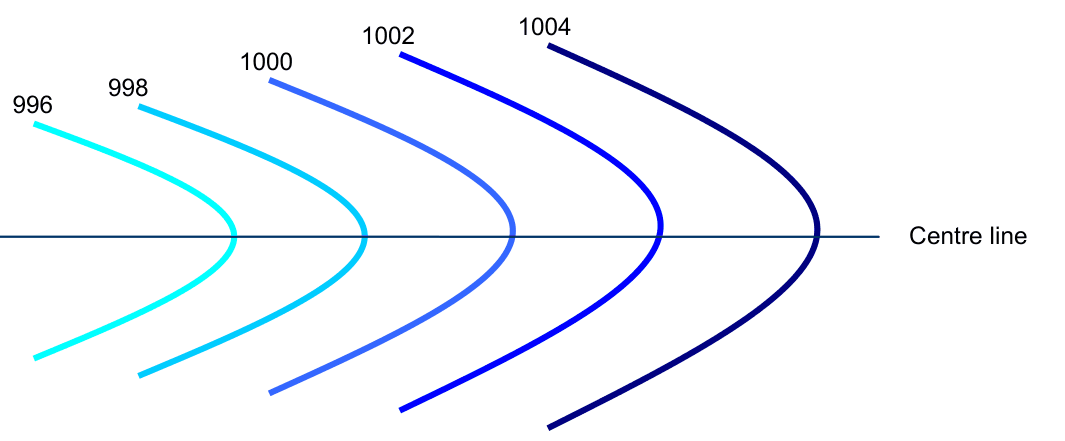
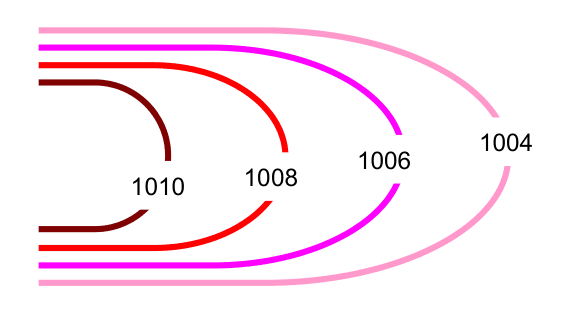
To represent the spatial distribution of pressure at a given time, all pressures are reduced to MSL. Pressures at stations are plotted on a chart, and isobars drawn at 2 hPa intervals.
| Pattern | Description | Weather | Hemisphere Note |
|---|---|---|---|
| Low (L) / Cyclone | Area enclosed by isobars with lowest pressure at centre. Two or more closed isobars = Depression. Severe = Cyclone. | Cloud and precipitation can occur with rising moist air; visibility varies | N Hemisphere: winds blow anticlockwise, converging & upward |
| High (H) / Anticyclone | Region enclosed by isobars with highest pressure at centre. | Fair weather but visibility may be poor | N Hemisphere: winds blow clockwise, veer and diverge outwards |
| Trough | "V" shaped extension of isobars from a low. Wind direction abruptly changes and backs. | Bad weather, associated with monsoon trough along Indo-Gangetic plains | — |
| Ridge | Wedge-like extension of isobars from high. Isobars rounded, not "V" shaped. | Fair weather; winds veer at a ridge | — |
| Col | Between two highs and two lows; 2 hPa higher than lows, towards highs. | Mixed — light variable winds | Winds light variable; pressure uniform |
| Cold Anticyclone | Forms in cold region behind a cyclone, compresses air as it moves away. | Warms up after sometimes | Blocks movement of migratory cyclones = Blocking Anticyclone |
Low = Cyclone = Convergence = Rising air = Bad Wx
High = Anticyclone = Divergence = Subsidence = Good Wx (but poor vis)
Trough = V-shape = Bad Wx | Ridge = Rounded = Good Wx | Col = Uniform = Light winds
flowchart LR
    A[Low/Depression] -->|winds converge| B[Upward Motion]
    B --> C[Cloud & Precipitation]
    C --> D[Bad Weather]
    E[High/Anticyclone] -->|winds diverge| F[Downward Motion/Subsidence]
    F --> G[Clear Sky]
    G --> H[Fair Weather\nbut Poor Visibility]
Practice Q&A — Atmospheric Pressure
Practice questions with verified answer key.
(a) Converge (b) Diverge (c) Go straight
In a Low, air flows inward (converges) and rises.
(a) Good Weather (b) Bad Weather (c) None
(a) Normal (b) Strong (c) Weak
(a) Over (b) Under (c) constant
(a) Pressure (b) Temperature Tendency (c) Pressure Tendency
(a) Aneroid (b) Mercury (c) Alcohol
(a) Depression (b) Secondary Low (c) Col
(a) High (b) Low
(a) Altimeter (b) ASI (c) V S I
(a) MSL (b) ASI (c) datum of 1013.2 hPa
(a) Ac flying over warm air mass (b) Ac flying over cold air mass (c) Both
(a) Same (b) More (c) Less
Cold air is denser, so pressure falls more rapidly with height over a cold column.
(a) 100 hPa (b) 1000 hPa (c) 3 hPa (d) 33 hPa
At MSL, 1 hPa ≈ 27–30 ft. For 1000 ft: 1000/30 ≈ 33 hPa.
(a) Isobars (b) Isotherms (c) Isoheights (d) Isoclinic
(a) 20,000 ft (b) 30,000 ft (c) 35,000 ft
Standard: 300 hPa = 30,000 ft = FL300
(a) 1010 hPa (b) 985 hPa (c) 1005 hPa (d) 990 hPa
(a) Contours far apart, weak wind
(b) Contours far apart, strong wind
(c) Isobars far apart, strong wind
(d) Isobars closely packed and strong wind
(a) Negative (b) Radiation (c) Subsidence (d) Airmass
(a) 1014.0 hPa (b) 1013.25 (c) Difficult to tell (d) More than QNH
If the aerodrome is at MSL, then QNH = QFF = 1014.0 hPa (no height correction needed, both reduce to the same level — MSL).
Master Reference Tables — Chapter 2
All Numerical Values
| Parameter | Value |
|---|---|
| Standard sea level pressure | 1013.25 hPa = 760 mm Hg = 29.92 in |
| Atmospheric pressure at sea level | 100,000 N/m² = 1 Bar |
| 1 hPa | 1000 dyn/cm² |
| 1 Bar | 1000 mb = 1000 hPa |
| hPa to inches conversion factor | × 0.02953 |
| Height formula per 1 hPa | 96T/p feet |
| At 1000 hPa, 300K: height per hPa | 28.8 ft |
| 1 hPa at MSL | 27 ft |
| 1 hPa at 2,000 ft | 30 ft |
| 1 hPa at 20,000 ft | 50 ft |
| 1 hPa at 40,000 ft | 100 ft |
| Pressure halves at altitude | 6 km |
| Vacuum (negligible pressure) | 100 km |
| Semi-diurnal maxima | 1000 hr & 2200 hr |
| Semi-diurnal minima | 0400 hr & 1600 hr |
| Equatorial diurnal pressure variation | 3–5 hPa |
| Alticor pressure correction | 30 ft per hPa |
| Alticor temperature correction | 1% per 3°C |
| Contour interval (700 & 500 hPa charts) | 40 gpm |
| Contour interval (300 & 200 hPa charts) | 80 gpm |
| 1 gpm | 9.8 J/kg |
| Isobar drawing interval | 2 hPa (surface charts) |
| Station elevation formula | (QNH − QFE) × 30 ft |
| 850 hPa level | 5,000 ft = FL50 |
| 700 hPa level | 10,000 ft = FL100 |
| 500 hPa level | 18,000 ft = FL180 |
| 400 hPa level | 24,000 ft = FL240 |
| 300 hPa level | 30,000 ft = FL300 |
| 200 hPa level | 38,000 ft = FL380 |
| 100 hPa level | 53,000 ft = FL530 |
Mnemonics / Memory Aids
L-H-L (Under Read): Low to High → Under Read, Cold to Warm → Under Read
LOW = BAD (Lows = convergence = cloud = bad weather)
HIGH = FAIR (Highs = divergence = subsidence = fair weather, poor visibility)
"Max at Ten and Ten" = Semi-diurnal maxima at 1000 & 2200 hr
TROUGH = V shape = Bad; RIDGE = Rounded = Good
COL = between 2H and 2L = Light variable winds
Quick Revision Summary
1. Standard sea level pressure = 1013.25 hPa = 760 mm = 29.92 in
2. 1 hPa = 1000 dyn/cm²; 1 Bar = 1000 hPa = 100,000 N/m²
3. Pressure halves at 6 km; vacuum at 100 km
4. Height per 1 hPa = 96T/p feet (28.8 ft at 1000 hPa, 300K)
5. Semi-diurnal maxima: 1000 & 2200 hr; minima: 0400 & 1600 hr
6. D Value = True Alt − Indicated Alt; decreases flying High → Low
7. QFE = zero on runway; QNH = ISA corrected to MSL; QFF = actual temp correction
8. Station elevation = (QNH − QFE) × 30 ft
9. 300 hPa = 30,000 ft; 500 hPa = 18,000 ft; 700 hPa = 10,000 ft; 850 hPa = 5,000 ft
10. Isobars close = strong wind; H-L-H = over-read; Low = bad weather; High = fair wx
Reinforce Chapter 2: Atmospheric Pressure
Test your knowledge and practice actual exam questions for Aviation Meteorology.