Atmosphere
by Ghost Aviator
Table of Contents
- 1. Composition and Structure of the Atmosphere
- 2. Constituents — Major Gases
- 3. Variable Gases, Greenhouse Gases & Dry/Saturated Air
- 4. Carbon Dioxide (CO₂) & Ozone (O₃)
- 5. Vertical Distribution of Air Mass
- 6. Thermal Structure of the Atmosphere
- 7. Atmospheric Layers in Detail
- 8. International Standard Atmosphere (ISA)
- 9. Jet Standard Atmosphere (JSA)
- 10. Quick Revision Summary
- 11. Practice Questions & Answers (Q1–Q45)
- 12. Master Reference Tables
1. Composition and Structure of the Atmosphere
📘 Definition — Atmosphere
The atmosphere of the earth is an envelope of homogeneous mixture of gases, called Air. It surrounds the earth and is attached to it due to gravitation. It moves with the earth at the same speed and direction.
- Total thickness: approximately 480 km
- 80% of the atmosphere is within 16 km
- No exact upper boundary — gradually merges with outer space
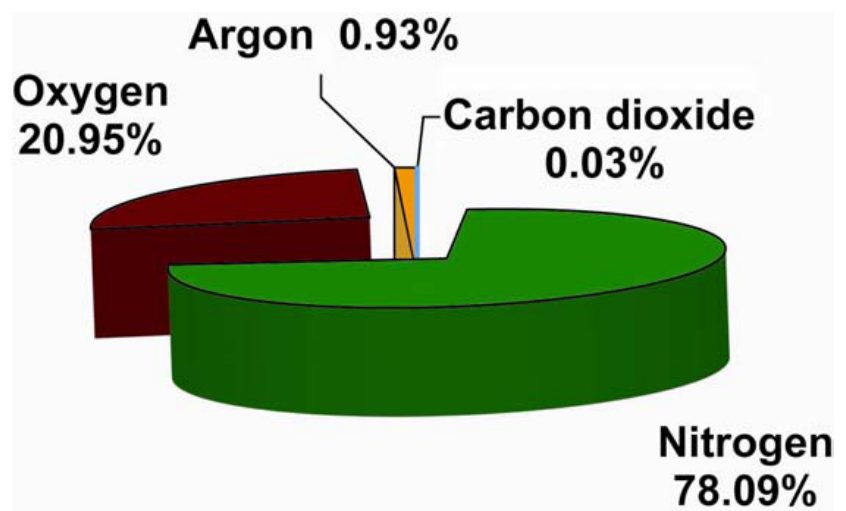
Characteristics of the Atmosphere
| Property | Detail |
|---|---|
| Weight | Has weight and hence exerts pressure |
| Compressibility | Compressible and expandable |
| Shape | Occupies space, has no definite shape |
| Mobility | Mobile — allows transfer of heat and moisture |
| Conductivity | Poor conductor of heat and electricity |
2. Constituents — Major Gases
| Gas | Symbol | % by Volume |
|---|---|---|
| Nitrogen | N₂ | 78.09% |
| Oxygen | O₂ | 20.95% |
| Argon | Ar | 0.93% |
| Carbon Dioxide | CO₂ | 0.035% |
Trace Gases
Neon, Helium, Methane, Krypton, Xenon, Nitrous Oxide, Iodine, H₂, O₃ (0.000007%), Ammonia, Carbon Monoxide, CO₂, SO, Nitrogen Dioxide. The atmosphere also contains water vapour (WV) and solid particles.
⭐ N₂ : O₂ Ratio — Exam Favourite
By Volume: N₂ : O₂ = 4 : 1
By Weight: N₂ : O₂ = 3 : 1
Mnemonic: "Volume 4, Weight 3 — N before O"
⚠️ Supplementary Oxygen Required
Due to rapid reduction of gases with height, supplementary oxygen is needed above 10,000 ft.
Homosphere vs Heterosphere
| Layer | Height | Characteristic |
|---|---|---|
| Homosphere | Up to ~80 km | Nearly uniform composition; well-mixed |
| Heterosphere | Above 80 km | Gases separate by molecular weight; composition varies |
3. Variable Gases, Greenhouse Gases & Dry/Saturated Air
Variable Gases
The gases like Water Vapour (WV), Carbon Mono Oxide, Sulphur di Oxide, Nitrogen di Oxide, and Methane vary in amount from place to place, being concentrated more in industrial areas, cities and water bodies, than in open areas. Though very small in quantity, these gases are very significant for weather and life.
Greenhouse Gases
📘 Greenhouse Effect
Water vapour, CO₂, O₃, Methane and some other gases are transparent to solar (Short Wave) radiation but partially absorb terrestrial (Long Wave) radiation, and re-radiate it. This keeps the earth warmer than it would have otherwise been.
Greenhouse gases: H₂O, CO₂, O₃, CH₄ (Methane)
⚠️ Global Warming Warning
Excessive amount of greenhouse gases is causing Global Warming, which is a serious threat to our life and needs to be limited.
Dry Air vs Saturated Air
Water in the atmosphere can exist in three states:
- Solid: Snow, Ice, Hail
- Liquid: Drizzle, Rain, Shower
- Gas: Water Vapour (WV)
| Concept | Detail |
|---|---|
| WV concentration | Rapidly decreases with height |
| Warmer air | Can hold greater amount of WV |
| Tropics (23½°N to 23½°S) | Air can hold up to 4% WV by volume |
| Above 30,000 ft | Very low WV due to very low temperatures |
| Saturated air | The water-vapour pressure equals the saturation vapour pressure at that temperature: 100% RH. The required amount of vapour changes with temperature. |
| Unsaturated air | RH < 100%. Unsaturated air may still contain water vapour; “dry air” in composition and gas-law calculations means air without water vapour. |
4. Carbon Dioxide (CO₂) & Ozone (O₃)
Carbon Dioxide (CO₂)
- Produced by burning of fuel, wood etc.
- Concentration substantial in industrial areas; negligible in Polar regions and higher altitudes
- Large amount of CO₂ is dissolved in the oceans
- Plants absorb CO₂, use its carbon as food and release O₂ into atmosphere
Ozone (O₃)
📘 Ozone Properties
- Forms in the upper atmosphere
- Absorbs Ultra Violet (UV) radiation from the Sun → raises temperature
- The ozone distribution depends on chemical formation, destruction and transport by atmospheric circulation.
- Maximum O₃ concentration: 20–25 km
- O₃ found between 10–50 km
✅ Why Ozone Matters for Aviation & Life
Ozone protects us from the ill effects (like skin cancer, sunburn and cataracts) of UV radiation.
Ozone Hole
⚠️ Ozone Depletion
In recent times the O₃ layer has thinned and large holes have developed mainly over the Polar and other latitudes due to:
- Atmospheric pollution
- Excessive use of halocarbon refrigerants, solvents, chlorofluoro carbons
- On reaching Stratosphere they release halogen atoms through photodissociation → breaks down O₃ into O₂
Solid Particles (Aerosols)
Particles such as salt from evaporating sea water, dust from arid regions, industrial particles:
- Obscure solar radiation and affect visibility and temperature
- Act as condensation nuclei → promote condensation of WV prematurely
- In larger cities/industrial areas: frequent fog and smog (mixture of fog and smoke) due to high concentration of particles
5. Vertical Distribution of Air Mass
| Height | Fraction of Atmosphere Contained Below |
|---|---|
| 6 km | 1/2 (50%) |
| 10 km | 3/4 (75%) |
| 35 km | 99% |
⭐ Memory Aid
"6–10–35 = Half–3/4–All"
Half the atmosphere below 6 km; ¾ below 10 km; 99% below 35 km.
6. Thermal Structure of the Atmosphere
📘 How the Atmosphere is Heated
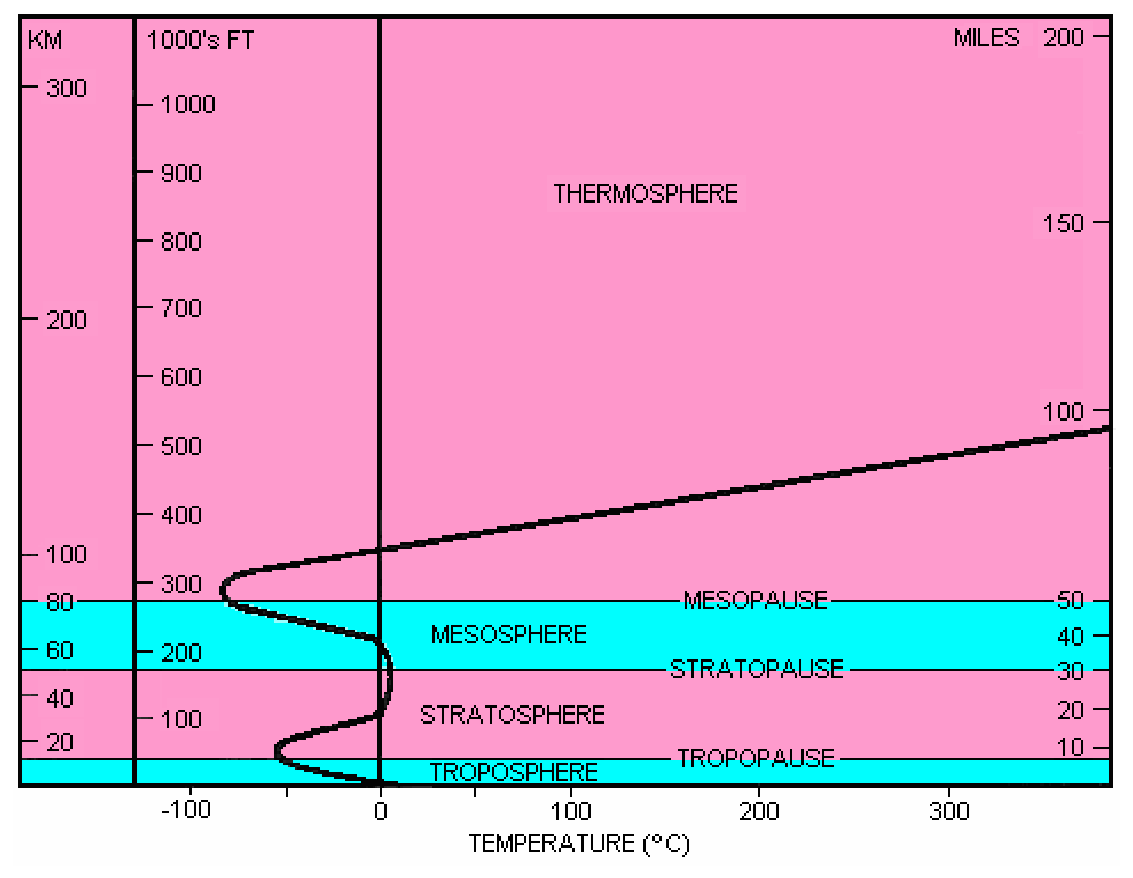
Solar radiation heats the earth and the earth in turn heats up the atmosphere by conduction, convection, radiation and release of latent heat by condensation of water vapour. Hence temperature falls with height, up to a certain height. The atmosphere is thus heated from below and not from above.
Heat Flow from Earth's Surface
| Type of Heat | Mechanism | Percentage |
|---|---|---|
| Sensible Heat | Conduction, Convection, Radiation | 23% |
| Latent Heat | Evaporation, Condensation, Sublimation | 77% |
⭐ Exam Tip
Latent heat transfer is dominant at 77%. Sensible heat = 23%. Mnemonic: "Latent is Larger (77)"
Thermal Structure — Visual Diagram
7. Atmospheric Layers in Detail
A. Troposphere
📘 Troposphere
- Lowest portion of the atmosphere
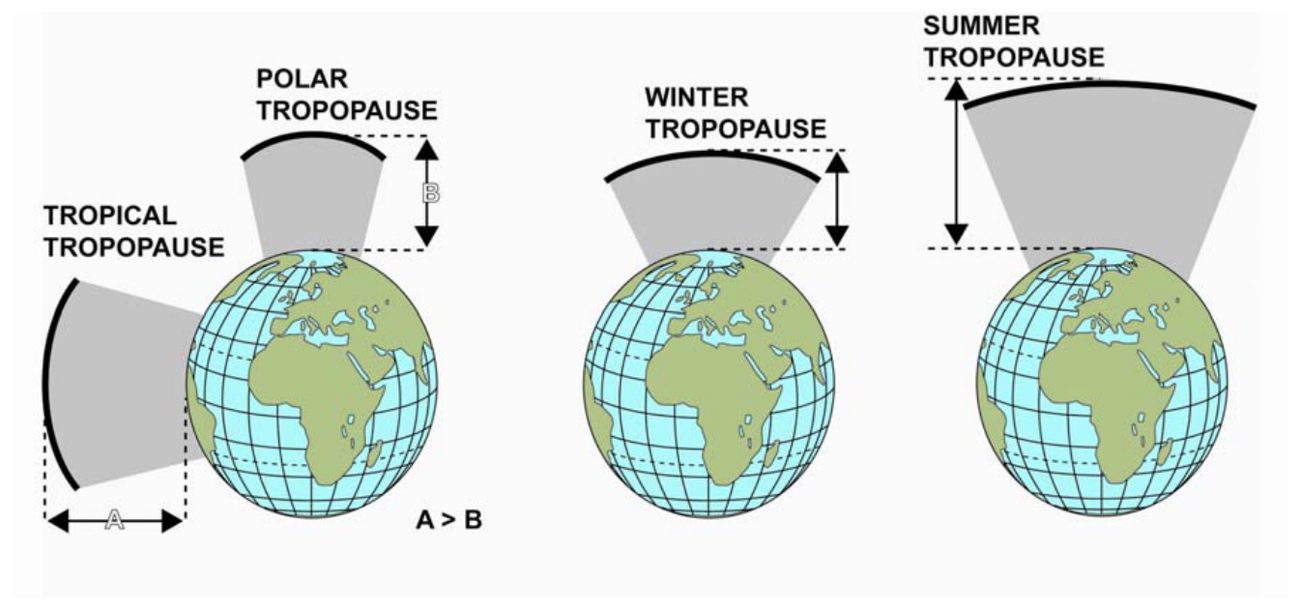
- Extends from surface to 16–18 km at equator and 8–10 km at poles
- Higher height at equator due to rising hot air convection currents
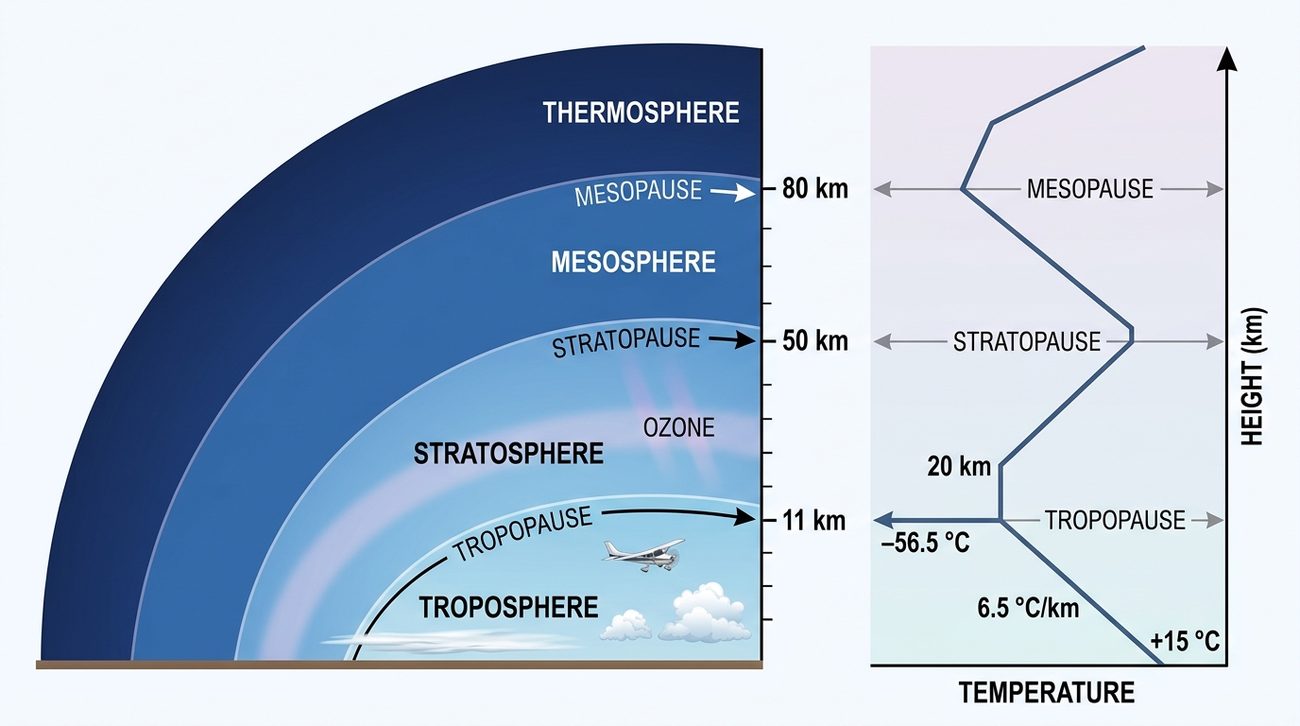
- Temperature falls at ~6.5°C/km — called the Lapse Rate
- All kinds of weather occur here; turbulent mixing
- Contains 75% of atmospheric mass and 99% of water vapour and aerosols
| Sub-Layer | Height Range |
|---|---|
| Lower Troposphere | Surface to 2.1 km |
| Mid Troposphere | 2.1 km to 7.6 km |
| Upper Troposphere | 7.6 km to Tropopause |
B. Tropopause
📘 Tropopause
- Top of the troposphere; marks boundary between Troposphere and Stratosphere
- At tropopause: lapse rate reduces to 1–2°C/km or temperature stops falling
- Controlled by: Surface Temperature, Latitude, Season, Land-Sea distribution, Synoptic Situation
- Temperature at equator: –70° to –75°C
- Temperature at poles: –40° to –45°C
- At lower height in Winters than Summers
- Warmer the surface → Higher the tropopause
⭐ Tropopause Breaks/Folds
There are two regions where tropopause abruptly changes height, called breaks/folds:
- At about 40° Lat and 60° Lat
- Break at 40°Lat is more prominent
- Jet streams occur at these breaks
| Type | Pressure Level | Latitude Range | Height (India) | Temp (India) | Associated Jet |
|---|---|---|---|---|---|
| Polar Tropopause | ~300 hPa | Lat. 45°–60° polewards | – | – | Polar Front Jet (southern end) |
| Middle Tropopause | ~200 hPa | Between Polar & Tropical | ~11.5 km (winters ~23°N) | –45°C | – |
| Tropical Tropopause | ~100 hPa | Lat. 35°–40° | ~11.5 km (winters ~23°N) | –45°C | Subtropical Jet (STJ) at southern end |
✅ Importance of Tropopause for Pilots
- Maximum height clouds can reach
- Jet streams and maximum wind speeds occur just below it
- Clear Air Turbulence (CAT) occurs just below it
C. Stratosphere
📘 Stratosphere (Tropopause to ~50 km)
- Initially (8–10 km above tropopause) isothermal
- Temperature then increases slowly and towards the top sharply
- Inversion produced by absorption of UV radiation from sun by ozone
- Ozone layer found at height of ~25 km
- Very dry and stable region — low humidity, no weather
- Above stormy weather; steady, strong, horizontal winds
- Nacreous Clouds (Mother of Pearl Clouds) sometimes seen in higher latitudes in winters
Stratopause: Upper boundary of the Stratosphere.
D. Mesosphere
📘 Mesosphere (Stratopause to ~80 km)
- Extends 50–80 km from Stratopause
- Lack of solar radiation absorption + weak vertical mixing → temperatures fall with height
- Noctilucent Clouds seen occasionally in Polar regions
Mesopause: Top of Mesosphere. Temperatures stop falling. Coldest area of atmosphere. Temperature at 80 km = –100°C (173.15 K). Meteors burn up in this layer.
E. Thermosphere
📘 Thermosphere / Ionosphere (80 km+)
- From Mesopause to end of atmosphere
- Temperatures increase with height
- Above 60 km also called Ionosphere
- Important for radio wave propagation
- Serious interference in radio propagation during solar disturbances
F. Exosphere
📘 Exosphere (outermost layer)
- Outermost layer extending up to 10,000 km from top of Thermosphere
- Molecules, ozone and atoms escape into space
- Air is very thin — few particles; very active with very high temperature but far apart → very little heat present in this layer
Atmospheric Layers — Process Flowchart
flowchart TD
    A["🌍 Earth's Surface\n(0 km)"] --> B["TROPOSPHERE\n0–18 km (equator), 8–10 km (poles)\nTemp ↓ at 6.5°C/km\nAll weather here | 75% mass | 99% WV"]
    B --> C{"TROPOPAUSE\nTemp stops falling\nJet streams & CAT below it"}
    C --> D["STRATOSPHERE\n~18–50 km\nOzone at 25 km absorbs UV\nTemp ↑ (inversion)\nStable, dry, no weather"]
    D --> E{"STRATOPAUSE"}
    E --> F["MESOSPHERE\n~50–80 km\nTemp ↓ with height\nNoctilucent clouds (polar)\nMeteors burn here"]
    F --> G{"MESOPAUSE\n–100°C / 173 K\nColdest point"}
    G --> H["THERMOSPHERE / IONOSPHERE\n80 km+\nTemp ↑ with height\nRadio wave propagation"]
    H --> I["EXOSPHERE\nTo 10,000 km\nMolecules escape to space"]
    style A fill:#90caf9
    style B fill:#64b5f6
    style C fill:#fff9c4
    style D fill:#a5d6a7
    style E fill:#fff9c4
    style F fill:#ffcc80
    style G fill:#fff9c4
    style H fill:#ef9a9a
    style I fill:#ce93d8
8. International Standard Atmosphere (ISA)
📘 What is ISA?
A standard average atmosphere specified for various purposes like design and testing of aircraft, evaluation of aircraft performance, calibration of altimeters. The most widely used is the ICAO ISA (International Standard Atmosphere).
ISA Specifications
| Parameter | Value |
|---|---|
| Air Condition | Dry |
| Temperature at MSL | 15°C (288.15 K) |
| Pressure at MSL | 1013.25 hPa |
| Density at MSL | 1225 g/m³ |
| Acceleration due to gravity | 980.665 cm/s² |
| Lapse Rate (up to 11 km / 36,090 ft) | 6.5°C/km (1.98°C/1000 ft ≈ 2°C/1000 ft) |
| Temperature 11–20 km (up to 65,617 ft) | –56.5°C (constant / isothermal) |
| Temperature 20–30 km | Rises at 1°C/km with temp –44.5°C at 32 km (104,987 ft) |
ISA Deviation Formula
ISA Deviation = Actual Temperature − ISA Temperature
Worked Example 1:
Actual temp at 2 km = 05°C
ISA temp at 2 km = 15 – (6.5 × 2) = 15 – 13 = 2°C
ISA Deviation = 05 – 02 = +03°C
Worked Example 2:
Pressure at MSL = 1002.25 hPa
ISA Pressure at MSL = 1013.25 hPa
ISA Deviation = 1002.25 – 1013.25 = –11 hPa
Worked Example 3:
Actual temp at 19 km = –60°C
ISA temp at 19 km = –56.5°C (constant 11–20 km)
ISA Deviation = –60 – (–56.5) = –3.5°C → answer –03.5°C
⭐ Key ISA Numbers to Remember
15-25-56.5-36090
MSL Temp = 15°C | MSL Pressure = 1013.25 hPa | Isothermal at –56.5°C | Isothermal starts at 36,090 ft (11 km)
9. Jet Standard Atmosphere (JSA)
📘 Why JSA?
ISA values are satisfactory for aircraft operating below 30,000 ft, but NOT above. For space flights and very high altitude flying and engine manufacturing, additional specific values are required. JSA was introduced to meet these requirements.
| Parameter | ISA | JSA |
|---|---|---|
| MSL Temperature | 15°C (288.15 K) | 15°C (288.15 K) |
| Lapse Rate | 6.5°C/km (1.98°C/1000 ft) | 2°C/1000 ft |
| Tropopause | Yes (at 11 km) | No Tropopause |
🚀 Quick Revision Summary — Chapter 1: Atmosphere
| Key Fact | Value |
|---|---|
| Total atmosphere thickness | ~480 km |
| 80% atmosphere within | 16 km |
| N₂ : O₂ by Volume | 4:1 | By Weight: 3:1 |
| Supplementary O₂ above | 10,000 ft |
| Homosphere up to | ~80 km |
| Max WV (tropics) | 4% by volume |
| Saturated Air RH | 100% |
| Ozone max concentration | 20–25 km |
| Ozone range | 10–50 km |
| Sensible heat | 23% |
| Latent heat | 77% |
| Troposphere height (equator) | 16–18 km |
| Troposphere height (poles) | 8–10 km |
| Lapse rate | ~6.5°C/km |
| WV + aerosols in troposphere | 99% |
| Atmospheric mass in troposphere | 75% |
| Tropopause temp (equator) | –70° to –75°C |
| Tropopause temp (poles) | –40° to –45°C |
| Stratosphere to | ~50 km |
| Ozone layer height | ~25 km |
| Mesosphere range | 50–80 km |
| Mesopause temperature | –100°C (173.15 K) |
| Ionosphere above | 60 km |
| Exosphere up to | 10,000 km |
| ISA MSL Temp | 15°C (288.15 K) |
| ISA MSL Pressure | 1013.25 hPa |
| ISA MSL Density | 1225 g/m³ |
| ISA Lapse Rate | 6.5°C/km up to 11 km |
| ISA Isothermal zone | –56.5°C, 11–20 km |
| JSA Lapse Rate | 2°C/1000 ft (no tropopause) |
Practice Questions & Answers
Master Reference Tables
1. All Numerical Values — Chapter 1
| Parameter | Value | Source |
|---|---|---|
| Atmosphere total thickness | ~480 km | Composition |
| 80% atmosphere below | 16 km | Composition |
| N₂ by volume | 78.09% | Constituents |
| O₂ by volume | 20.95% | Constituents |
| Argon by volume | 0.93% | Constituents |
| CO₂ by volume | 0.035% | Constituents |
| O₃ trace concentration | 0.000007% | Constituents |
| N₂:O₂ by Volume | 4:1 | Ratios |
| N₂:O₂ by Weight | 3:1 | Ratios |
| Supplemental O₂ required above | 10,000 ft | Physiology |
| Homosphere up to | ~80 km | Structure |
| Max WV (tropics) | 4% by volume | WV |
| WV minimal above | 30,000 ft | WV |
| Tropics latitude band | 23½°N to 23½°S | WV |
| Ozone range | 10–50 km | Ozone |
| Ozone max concentration | 20–25 km | Ozone |
| Ozone layer (Stratosphere) | ~25 km | Ozone |
| Airmass below 6 km | 1/2 (50%) | Vertical dist. |
| Airmass below 10 km | 3/4 (75%) | Vertical dist. |
| Airmass below 35 km | 99% | Vertical dist. |
| Sensible heat transfer | 23% | Thermal |
| Latent heat transfer | 77% | Thermal |
| Troposphere height (equator) | 16–18 km | Layers |
| Troposphere height (poles) | 8–10 km | Layers |
| ISA Lapse rate | 6.5°C/km (≈1.98°C/1000 ft) | Layers |
| Atmospheric mass in troposphere | 75% | Layers |
| WV+aerosols in troposphere | 99% | Layers |
| Lower Troposphere | Surface – 2.1 km | Layers |
| Mid Troposphere | 2.1 – 7.6 km | Layers |
| Upper Troposphere | 7.6 km – Tropopause | Layers |
| Tropopause lapse rate | 1–2°C/km | Tropopause |
| Tropopause temp (equator) | –70° to –75°C | Tropopause |
| Tropopause temp (poles) | –40° to –45°C | Tropopause |
| Tropopause breaks at | ~40° and ~60° Lat | Tropopause |
| Polar Tropopause pressure | ~300 hPa | Tropopause |
| Tropical Tropopause pressure | ~100 hPa | Tropopause |
| Middle Tropopause pressure | ~200 hPa | Tropopause |
| Stratosphere extent | ~18–50 km | Layers |
| Mesosphere extent | 50–80 km | Layers |
| Mesopause temperature | –100°C (173.15 K) | Layers |
| Ionosphere above | 60 km | Layers |
| Exosphere extent | Up to 10,000 km | Layers |
| ISA MSL Temperature | 15°C (288.15 K) | ISA |
| ISA MSL Pressure | 1013.25 hPa | ISA |
| ISA MSL Density | 1225 g/m³ | ISA |
| ISA gravity | 980.665 cm/s² | ISA |
| ISA isothermal zone | 11–20 km at –56.5°C | ISA |
| ISA isothermal start | 11 km = 36,090 ft | ISA |
| ISA isothermal end | 20 km = 65,617 ft | ISA |
| ISA temp rise zone (20–30 km) | 1°C/km, –44.5°C at 32 km | ISA |
| JSA Lapse rate | 2°C/1000 ft | JSA |
| JSA valid below | 30,000 ft (ISA ok); JSA for above | JSA |
2. Mnemonics Summary
| Mnemonic | What it Helps Remember |
|---|---|
| T-S-M-T-E | Atmospheric layers bottom to top: Troposphere, Stratosphere, Mesosphere, Thermosphere, Exosphere |
| Volume 4, Weight 3 | N₂:O₂ ratio by Volume=4:1, by Weight=3:1 |
| Latent is Larger (77%) | Latent heat transfer = 77%, Sensible = 23% |
| 6–10–35 = Half–3/4–All | Vertical air mass distribution |
| Hotter = Higher (Tropopause) | Warmer surface → higher tropopause |
| 15–1013.25–1225 | ISA MSL: Temp, Pressure, Density |
| 11 km = 36,090 ft = –56.5°C | ISA tropopause and isothermal start |
| Na-Stra, Noc-Meso | Nacreous clouds = Stratosphere; Noctilucent = Mesosphere |
| W-C-O-M | Greenhouse gases: Water vapour, CO₂, O₃, Methane |
| 20–25 is Ozone's zone | Maximum ozone concentration at 20–25 km |
| ISA Dev = Actual – ISA | Formula for ISA deviation (positive = warmer than standard) |
| Break at 40, Fold at 60 | Tropopause discontinuities at ~40° and ~60° latitude |
3. Formula Sheet
Key Formulae — Chapter 1
ISA Temperature at altitude h (km), for h ≤ 11 km:
T(h) = 15 – 6.5 × h [°C]
Example: h = 5 km → T = 15 – 32.5 = –17.5°C
ISA Deviation:
ISA Deviation = T_actual – T_ISA
Positive = warmer than ISA | Negative = colder than ISA
ISA Isothermal zone (11–20 km):
T = –56.5°C (constant; no lapse rate applies)
Kelvin–Celsius conversion:
K = °C + 273.15
–56.5°C = 216.65 K | –100°C = 173.15 K | 15°C = 288.15 K
Key facts — Atmosphere
The figures from this chapter worth carrying into the exam hall.
- ISA sea level pressure
- The International Standard Atmosphere takes mean sea level pressure as 1013.25 hPa (29.92 inches of mercury).
- ISA sea level temperature
- ISA mean sea level temperature is +15°C, with a density of 1.225 kg/m³.
- ISA lapse rate
- Temperature in the ISA falls by 1.98°C per 1000 ft — used as 2°C per 1000 ft in practice — up to the tropopause.
- ISA tropopause
- The ISA tropopause is at 36 090 ft (11 km), where the temperature is −56.5°C and stops falling with height.
- Composition of the atmosphere
- Dry air is about 78% nitrogen and 21% oxygen by volume, the remaining 1% being argon, carbon dioxide and trace gases.
- Vertical divisions
- From the surface upward the atmosphere divides into troposphere, stratosphere, mesosphere and thermosphere, each separated from the next by a pause.
Reinforce Chapter 1: Atmosphere
Test your knowledge and practice actual exam questions for Aviation Meteorology.