Topographical Maps and Map Reading
by Ghost Aviator
and Map Reading
Introduction
Modern aircraft navigation systems — GPS, INS, FMS — are highly reliable, but they fail occasionally or suffer degraded accuracy. Many light aircraft are not equipped with sophisticated navigation systems at all. There is therefore an enduring need for pilots to develop and maintain visual navigation skills using the basic aids of map, compass, stopwatch, eye and brain.
It is essential that pilots can interpret the conventional symbols (the legend) of all the aeronautical charts they use. Misreading a symbol — confusing a military airport with a civil one, an unlighted obstruction with a lighted one — can have serious consequences.
Aeronautical charts show three basic characteristics which form the structure of this chapter:
- Relief (Terrain) — the shape and elevation of the land surface
- Other Features — man-made and natural planimetric features
- Scale — the ratio between chart distance and Earth distance
Relief (Terrain)
If an aircraft is to be navigated safely in poor weather, terrain must be identified and cleared — either by flying around high ground or over it at a safe altitude. In good visibility, terrain features are invaluable visual references. Either way, pilots must understand how the ground is depicted on aeronautical charts.
Contour Lines
Contour lines join all points on the ground at the same height above mean sea level. The pattern of contours reveals the shape of the terrain:
- Closely spaced contours = steep gradient
- Widely spaced contours = gentle slope
- Concentric ovals, increasingly small = hill or mountain summit
- V-shapes pointing uphill (up-valley) = valley (stream flows down the V)
- V-shapes pointing downhill (down-slope) = ridge spur
The contour interval — the vertical difference between adjacent contours — is stated in the chart legend. Common values: 500 ft on 1:500 000 charts; 1 000 ft on 1:1 000 000 charts. Every fifth contour (the index contour) is drawn thicker and labelled with its altitude in feet or metres.
Spot Heights and Mountain Triangles
A spot height is a precise, surveyed elevation of a specific point, shown as a black dot with a number alongside. A mountain triangle (▲) marks the summit with the highest accuracy. Spot heights are especially important where contour spacing makes exact summit height ambiguous.
Hypsometric Tinting (Layer Colouring)
Bands of colour between contour lines give an immediate visual impression of elevation without counting contour lines. Typical colour scheme: deep green for sea level, lighter greens for lowland, buff/tan for intermediate, orange-brown for highland, purple-grey for high mountain. The exact scheme is always defined in the chart legend.
Form Lines
In areas where survey data is sparse, form lines (dashed lines resembling contours) indicate the approximate terrain shape. They are less reliable than surveyed contours — treat them as indicative, not precise.
Hill Shading
Some charts superimpose grey-tone shading to simulate shadows cast by sunlight from the north-west. This gives a strong three-dimensional impression: ridges look raised, valleys look sunken. Hill shading is particularly effective at showing complex terrain quickly.
⚠ The "Hill in Front of the Hill" Trap
When approaching rising terrain, foreshortening can make a nearer, lower ridge appear to merge visually with a higher range behind it. As you fly forward, terrain clearance decreases much faster than expected. This is especially dangerous in reduced visibility or when flying low. Always add a generous margin to your calculated terrain clearance.
Visual Illusions Related to Terrain
Flying over a smooth water surface, fresh snow, or a featureless desert makes it extremely difficult to judge height. Scrub bushes in desert or tundra can appear to be full-size trees, creating a false impression of altitude. At night, scattered lights below (ships, oil rigs, isolated buildings) can be confused with stars — especially after manoeuvres when the horizon reference is lost.
MEF, MSA and Obstacle Clearance
Maximum Elevation Figure (MEF)
The MEF is shown in large type within each latitude/longitude grid rectangle on charts such as the TPC (Tactical Pilotage Chart) and ONC (Operational Navigation Chart). It represents the highest known elevation — natural or man-made — within that rectangle, with a clearance addition applied.
The MEF calculation:
- Find the highest natural terrain peak within the rectangle.
- Find the highest man-made obstruction (must be notified if ≥ 300 ft AGL in UK/US, ≥ 100 m in continental Europe).
- Add the clearance buffer: 100 ft if the highest feature is below 5 000 ft; 200 ft above 5 000 ft (US practice).
- Round up to the next 100 ft.
Minimum Safe Altitude (MSA)
Used primarily on European charts, MSA is conceptually similar to MEF but may include a larger terrain clearance margin. Always check which value is shown on the chart in use — confusing MEF with MSA could cost you the required safety margin. The difference may literally be a matter of life and death in IMC near high ground.
Unnotified Obstructions
The Unknown Hazard
Structures below the notifiable height (300 ft AGL, or 100 m in some countries) do not need to be reported. A new farm silo, a temporary crane, a wind turbine under construction — none of these may appear on the chart. The clearance buffer exists precisely to provide a margin against these unknowns. Flying at or near MEF is still not a guarantee of clearance from all obstacles.
Grid Rectangle Sizes by Chart Scale
| Chart / Scale | Grid Rectangle |
|---|---|
| CAA 1:500 000 / TPC | ½° lat × ½° long |
| ONC 1:1 000 000 | 1° lat × 1° long |
| Jeppesen small-scale | 5° lat × 5° long |
Scale
Scale is the relationship between the length of a line drawn between two positions on a chart and the actual distance on the Earth between those same points. Three methods of expression are in common use.
1. Statement in Words
For example: "One inch to ten nautical miles." Entirely self-explanatory. One linear inch on the chart represents ten nautical miles on the Earth's surface. This is the most immediately understandable form but is awkward when a chart is reproduced at a different size.
2. Representative Fraction (RF)
The RF converts the verbal statement into a pure ratio:
Formula
Scale = Chart Length ÷ Earth Distance
(both in identical units; the result is dimensionless)
By convention the chart length is always expressed as 1. So a 1:500 000 chart means 1 unit on the chart = 500 000 units on the ground. The RF is written as 1 : 500 000.
Large scale vs small scale: Think of the fraction itself. 1/50 000 is a larger number than 1/500 000. A larger fraction = larger scale = more detail over a smaller area. A 1:50 000 map shows individual buildings; a 1:1 000 000 chart shows an entire country.
Common Exam Conversions
- 1 : 500 000 → 1 cm = 5 km = 2.70 NM
- 1 : 1 000 000 → 1 cm = 10 km = 5.40 NM
- 1 : 250 000 → 1 cm = 2.5 km = 1.35 NM
- On any Lambert conformal chart, 1 minute of latitude = 1 NM
3. Graduated Scale Line (Scale Bar)
A graduated scale line is printed directly on the chart. It has the critical advantage of remaining correct even if the chart is enlarged or reduced for reproduction — the bar shrinks or grows with the image. Simply measure between two points with a straight edge and compare with the bar.
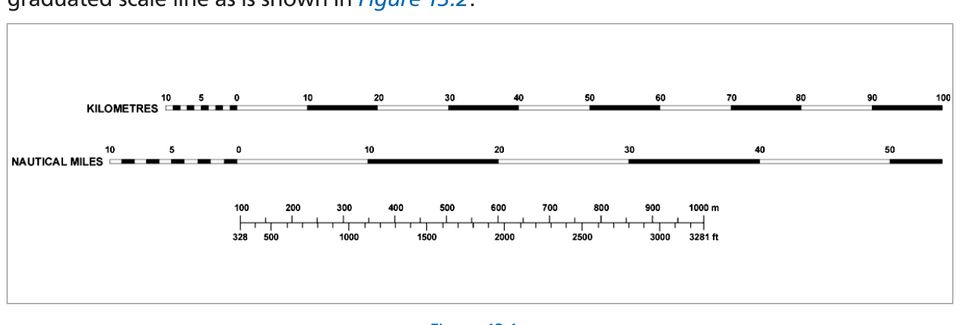
Figure 1 — Graduated scale line as printed on the chart — used to measure distances directly
The Latitude Scale
On aeronautical charts based on conic projections (Lambert Conformal, Transverse Mercator), the latitude scale on the chart margins can be used as a distance rule. One minute of arc of latitude = exactly 1 nautical mile at all latitudes on the Earth. Therefore a pair of dividers set to the distance between two points on the chart, then compared with the latitude margin, directly gives the distance in nautical miles.
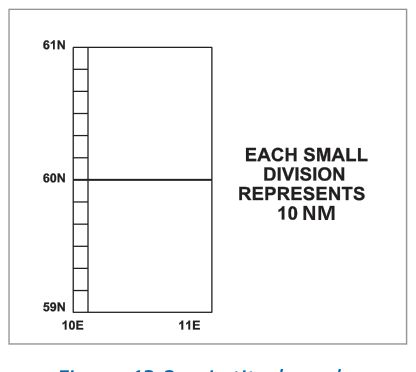
Figure 2 — Latitude scale — 1 minute of latitude = 1 NM; serves as a built-in distance ruler
Map Reading
Map reading is defined as visualising the physical features of the ground as represented on the map by symbols, and forming a mental picture of the ground by relating those features to one another. It is a cognitive skill that develops with practice.
Map-to-Ground (Confident Technique)
Used when you are confident of your approximate position. The sequence is:
- Study the chart: note what features should be ahead, left and right.
- Look outside and search for those features.
- Confirm (or challenge) your expectations.
- Update your mental model and look ahead to the next checkpoint.
This technique keeps you ahead of the aircraft. The map reading is done mostly in the air, in short glances, while maintaining lookout.
Ground-to-Map (Recovery Technique)
Used when position confidence has decreased. You observe the arrangement of features outside — a distinctive river bend, a coastal inlet, the shape of a town — and search the chart to find those same features, thus re-establishing your position. This technique is slower and requires more map-gazing, increasing head-down time.
Preflight Preparation
Good in-flight map reading starts on the ground. Preparation should include:
- Thorough study of the route; identify prominent features along and near track.
- Mark the chart with track lines, turning points, time/distance marks.
- Select visual checkpoints at 5–10 minute intervals (at planned groundspeed).
- Note altimeter settings required along the route.
- Brief yourself on any restricted or controlled airspace en route.
In-Flight Discipline
Navigation is only one of a pilot's responsibilities. Always:
- Maintain an active lookout — collision avoidance is paramount.
- Monitor weather and diversion options continuously.
- Check heading and compass synchronisation at regular intervals.
- Verify altimeter setting and terrain clearance altitude.
- Restart the stopwatch at each turning point and checkpoint.
Visual Checkpoints
A visual checkpoint is a ground feature that can be positively identified from the air and whose position is shown on the chart. The ideal checkpoint combines the following attributes:
- Prominent — visible at the planned altitude and in the expected weather
- Unique — cannot be confused with a similar feature nearby
- Definable — gives a precise position fix, not just an approximate area
- Permanent — unlikely to have changed since chart compilation
- Contrasting — visually distinct from its surroundings
Contrast changes with season (snow coverage, summer greenery), geographic location (desert vs temperate), time of day and altitude. Night visual navigation requires lit features entirely.
Coastlines
The best general-purpose visual checkpoint. Coastlines are unique (you cannot mistake a coast), highly distinctive in shape (bays, headlands, estuaries, islands), and visible at low altitude even in moderate visibility. A prominent headland or river mouth gives a precise position fix. Coastlines are also usable at night in good moonlight.
Motorways and Major Roads
A large motorway interchange (cloverleaf or trumpet junction) is arguably the finest inland checkpoint: unique shape, visible at high altitude, shown clearly on charts and rarely changed. Motorways themselves are wide, straight, often lit at night, and identifiable from the pattern of moving vehicles. Major A-roads are useful; minor roads are unreliable unless in sparse terrain.
Rivers and Coastlines
River meanders (S-bends) are highly distinctive from the air. A confluence (river junction) gives a particularly precise fix because two specific waterways must coincide. Large lakes with complex shorelines are excellent. Rivers are less useful in flood or when frozen, and lake shores can look different in drought years.
Railways
In open country, railway lines run in strikingly straight lines with very gradual curves. Junctions, stations and large viaducts are precise checkpoints. In industrial or urban areas, multiple lines make individual tracks hard to identify. Railways are rarely visible at night unless brightly lit at major stations.
Woods
Variable utility. A large wood with a distinctive shape (irregular outline, isolated from other woodland) is useful above 1 000 ft AGL. Below that altitude, the shape is hard to assess. Coniferous plantations are prone to shape changes from felling and replanting. Snow can make trees blend with fields; conversely, early spring snow-melt makes a canopy stand out strikingly. Use woods cautiously as primary checkpoints.
Other Features
Power stations, wind farms, large reservoirs, prominent isolated hills, and aeronautical ground lights (aero beacons) all make useful checkpoints. Wind farms are increasingly common and visible at great range, but may not yet appear on older chart editions. Power lines can be seen from their towers but require care — they cross large areas and individual spans are invisible until very close.
Uncertain of Position — Procedures
⚠ The Most Dangerous Action: Press On Regardless
Flying on in the hope that something familiar will appear is how pilots end up controlled into terrain, in airspace they have no clearance for, or over the sea with insufficient fuel. At the first sign of position uncertainty, take action immediately.
Immediate Actions When Uncertain
- Climb — if terrain permits. Greater altitude extends your visual range and increases obstacle clearance while you resolve the uncertainty.
- Maintain heading and log the time — continue on the last known heading. This builds a reliable DR track from the last known position.
- Define your circle of uncertainty — based on elapsed time since last known fix and your estimated navigation accuracy, work out the area within which you must be.
- Use radio aids — a VOR radial, DME distance, ADF bearing, or QDM from a D/F station can resolve the uncertainty in seconds. Call the nearest ATC unit.
- Apply ground-to-map — look for the most prominent feature visible and search the chart within your circle of uncertainty.
The Line Feature Technique
If still uncertain after the above steps, turn toward a prominent linear feature that lies outside your circle of uncertainty — a coastline, a motorway, a main railway. When you reach it, you know your position with certainty on that line. Turn and follow the feature until you find a definite visual checkpoint from which normal navigation can resume.
Q1 Answer Logic
Q1 of this chapter asks the best course of action when uncertain. The answer is a — set heading towards a line feature (coastline, river or motorway). This is the classic "lost" recovery: reach a known line, then follow it to a fix. Flying in reverse along the flight plan (b, d) compounds the problem without resolving it. Expanding circles (c) wastes time and fuel.
If All Else Fails
Do not fly toward high ground in poor weather below safety altitude. Do not enter controlled airspace without clearance. Declare urgency (MAYDAY or PAN PAN) on 121.5 MHz. ATC can provide radar identification, vectors to the nearest airport, and SAR assistance if required.
Chart Symbol Reference
The following pages are reproduced from the chapter appendix and contain the numbered aeronautical chart symbols referenced in Questions 2, 5, 6, 7 and 8. Study these carefully — obstruction symbols and radio navigation aid symbols are high-frequency examination topics.
Key Symbol Groups to Prioritise
| Category | What to Learn |
|---|---|
| Radio Navigation Aids | VOR (symbol 13), VORTAC (symbol 14), NDB (symbol 5), DME |
| Airports | Civil vs military; hard/soft surface; with/without control tower |
| Obstructions | Symbol 9 (lighted, <1 000 ft), 10 (lighted, >1 000 ft), 12 (group lighted), 15 (unlighted) |
| Aeronautical Lights | Symbol 3 = aeronautical ground light |
| Reporting Points | Compulsory (solid triangle) vs non-compulsory (open triangle) |
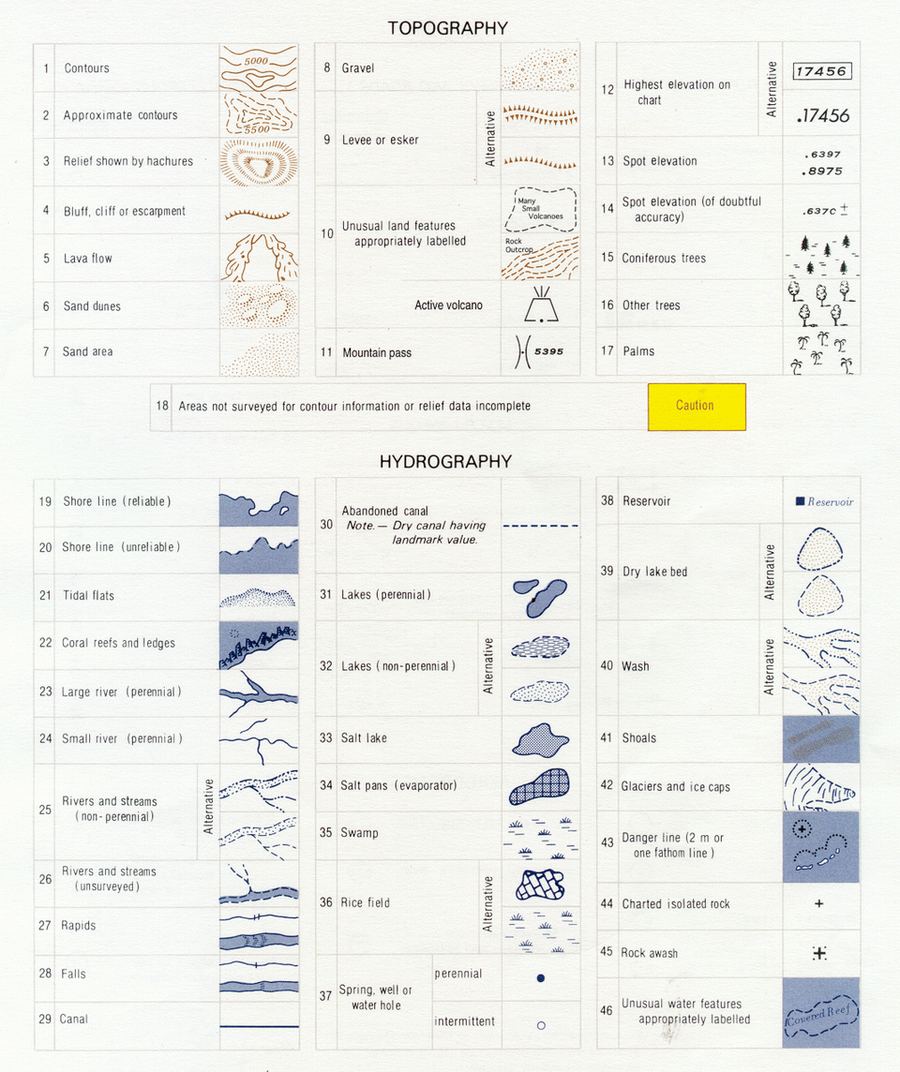
Figure 3 — Chart symbol reference — page 1
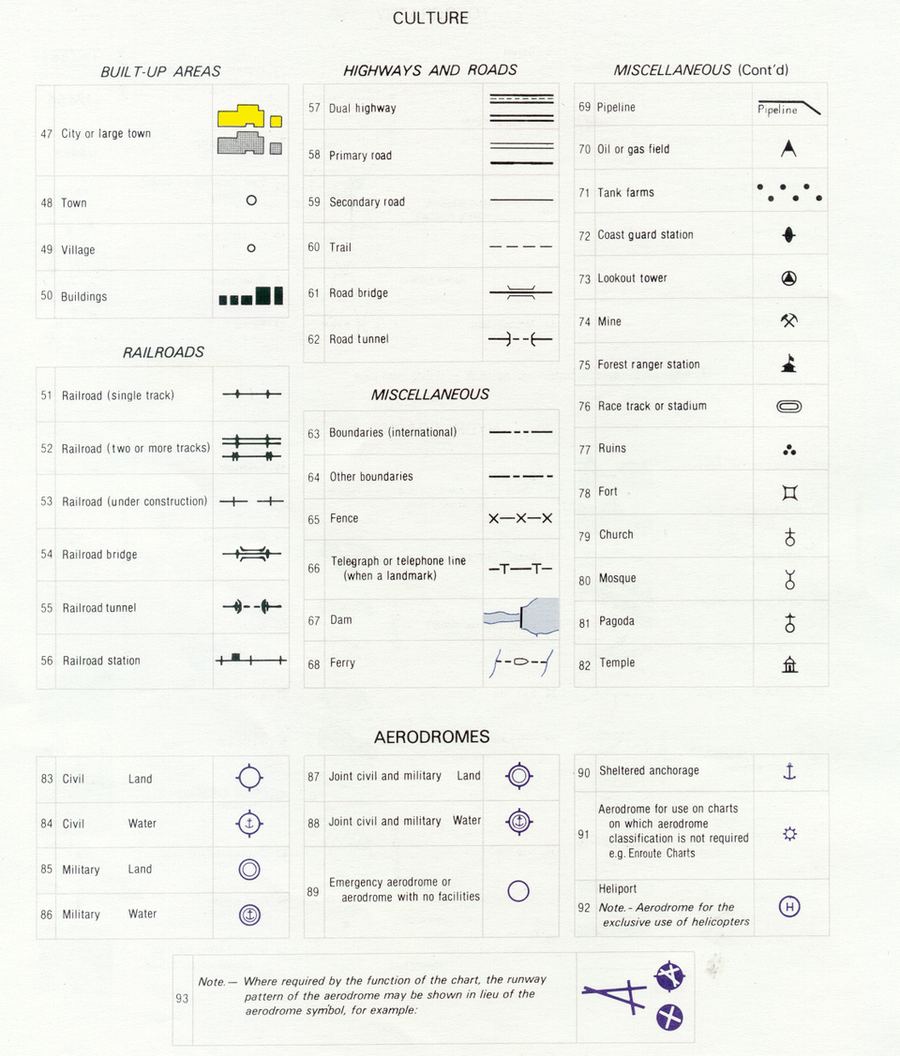
Figure 4 — Chart symbol reference — page 2
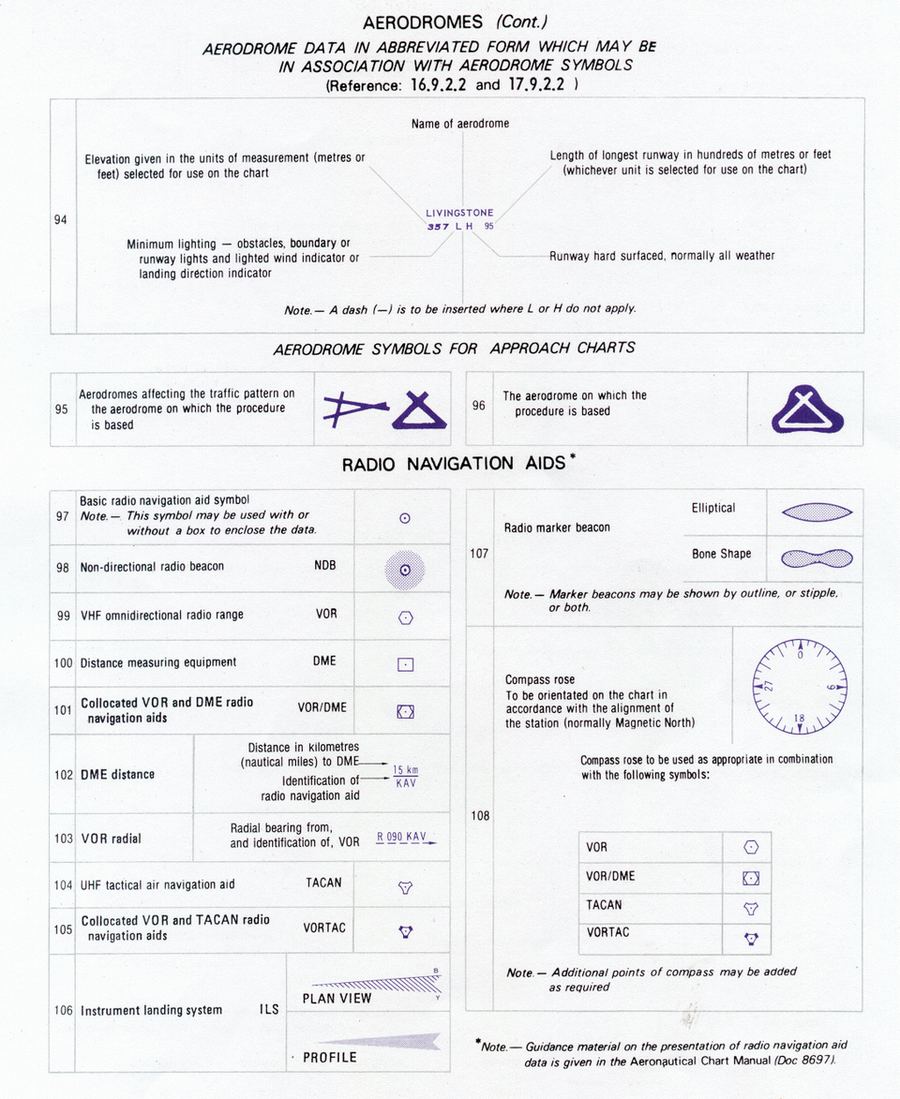
Figure 5 — Chart symbol reference — page 3
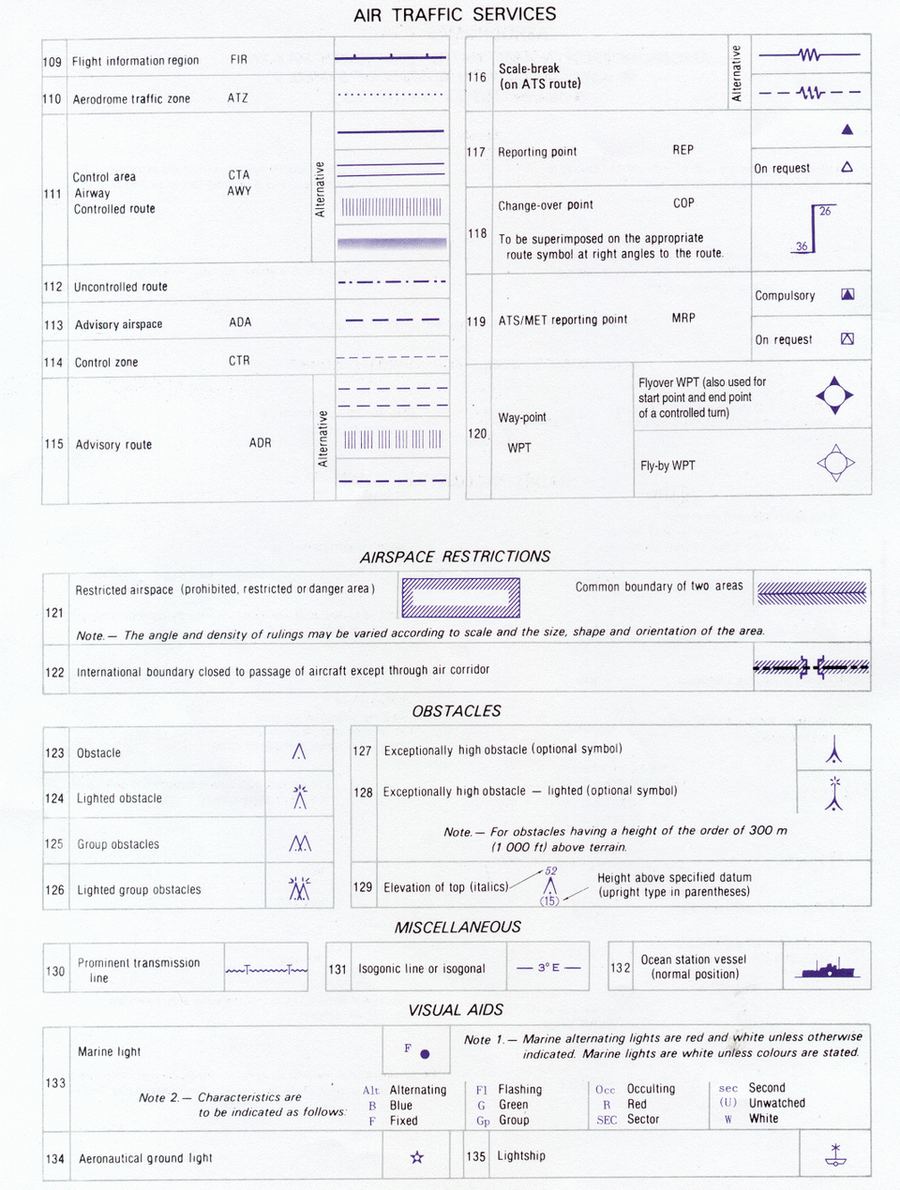
Figure 6 — Chart symbol reference — page 4
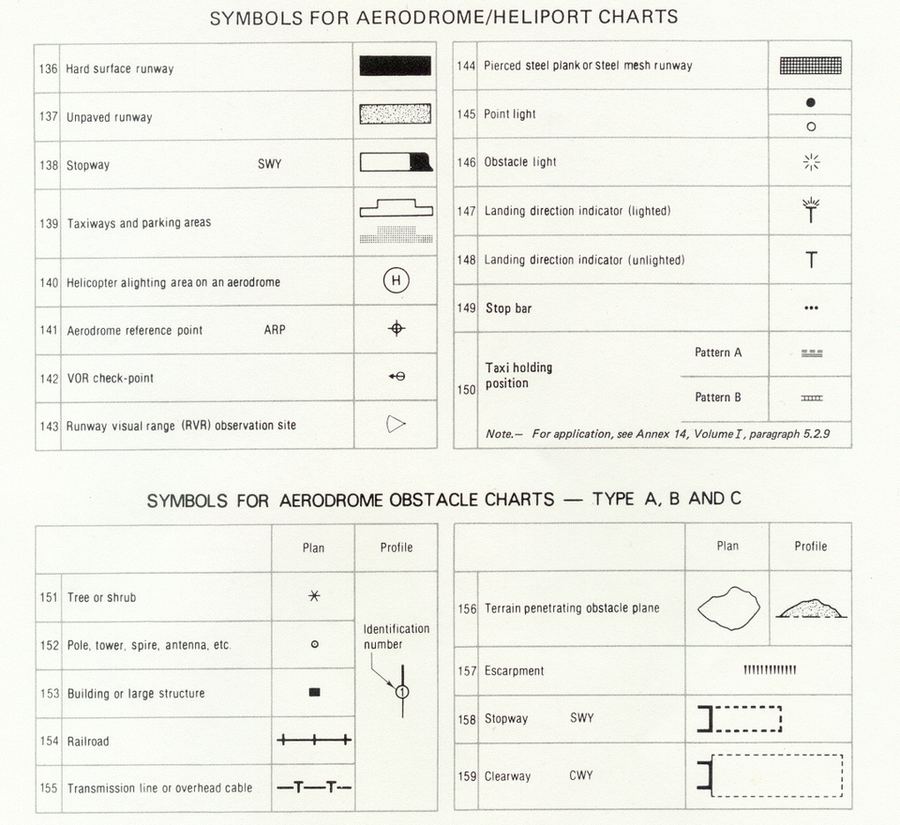
Figure 7 — Chart symbol reference — page 5
Appendix A — Symbols 16–21
Appendix A is specifically referenced in the practice questions below. Questions 3 and 4 additionally require an external Jeppesen E(LO)1 chart.
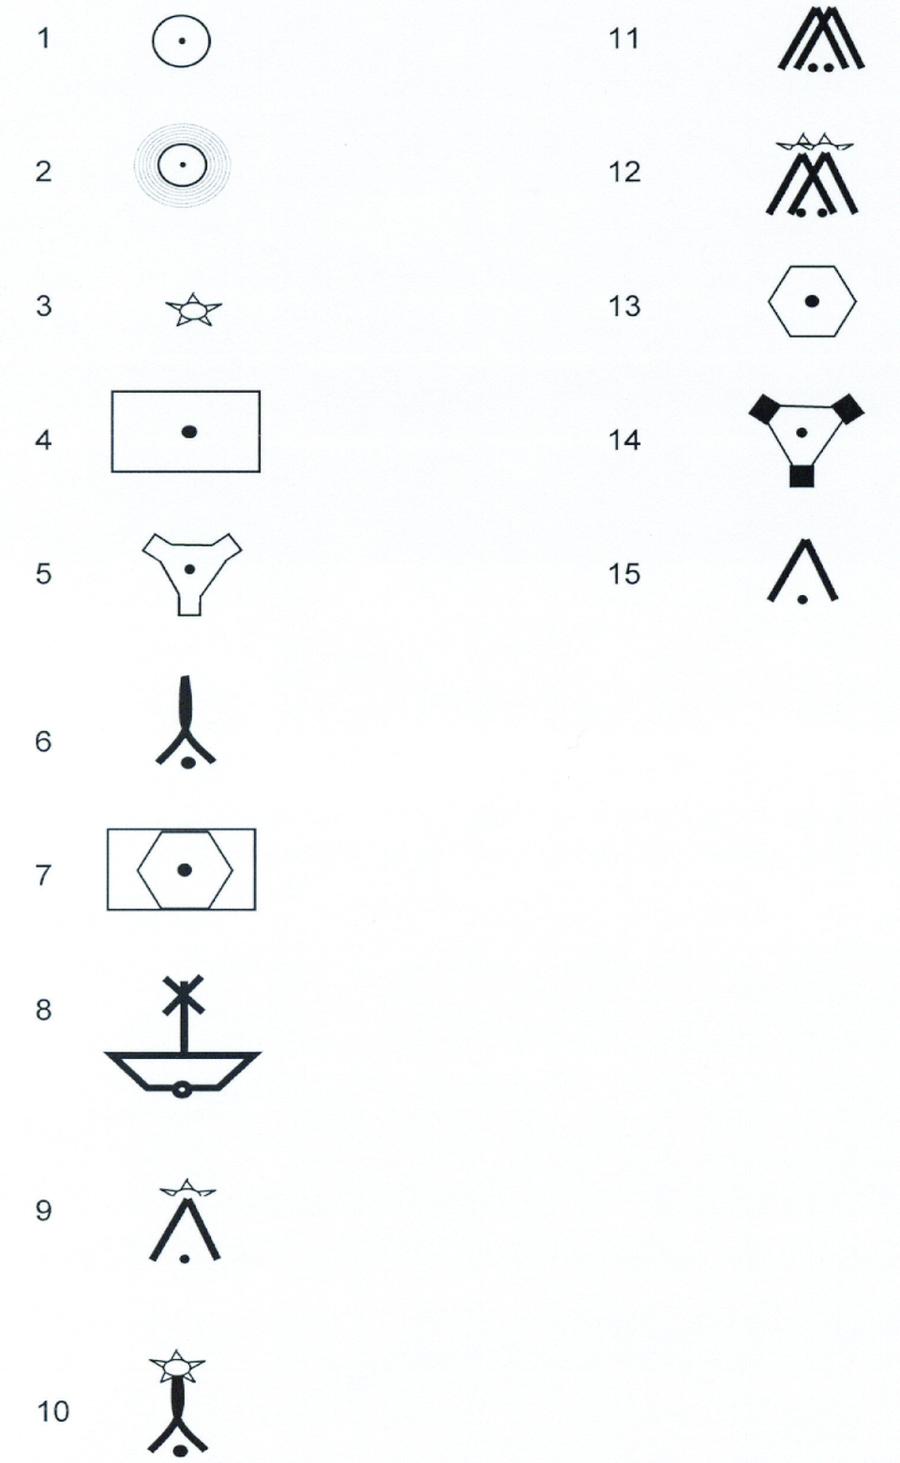
Figure 8 — Appendix A — chart symbols 16–21 (referenced in questions)
Practice Questions
Ten questions. Questions 3 and 4 require the Jeppesen E(LO)1 chart (an external publication). Questions 2, 5, 6, 7 and 8 use the symbol tables above. Tap any question to reveal the answer.
Q1You are flying a VFR route and have become uncertain of your position. Which is the best course of action?
Set heading toward a prominent linear feature outside your circle of uncertainty. When you reach it you have a certain position on that line. Follow it to a definite fix and resume navigation. Reversing (b/d) retraces unknown territory; expanding circles (c) waste time and add distance to an already diminishing fuel state.
Q2Please refer to Appendix A (Figure 8 above). What is the symbol for an unlighted obstacle?
Symbol 15 is the unlighted obstacle. Symbol 9 = lighted obstacle below 1 000 ft AGL. Symbol 10 = exceptionally high (over 1 000 ft AGL) lighted obstruction. Symbol 12 = group of lighted obstructions. Note: the absence of the lightning-bolt 'lit' indicator is the key discriminator for an unlighted obstacle.
Q3Using the Jeppesen E(LO)1, position 5211N 00931W — which of the following denotes all the symbols?
Answer retained verbatim from the published answer key: civil airport, ILS, NDB.
Q4Using the Jeppesen E(LO)1 chart, what are the symbols at Galway Carnmore (5318.1N 00856.5W)?
Answer retained verbatim from the published answer key: civil airport, NDB, DME, non-compulsory reporting point.
Q5Which of the following is the symbol for an exceptionally high (over 1 000 feet AGL) lighted obstruction?
Symbol 10 is the exceptionally high lighted obstruction — the one that exceeds 1 000 ft AGL. Symbol 9 is the lower lighted obstruction (below 1 000 ft AGL). The 1 000 ft threshold is the key discriminator between symbols 9 and 10. Symbol 15 is the unlighted obstruction. Symbol 6 is in a different category.
Q6What symbol is used to show a VORTAC on a map/chart?
Symbol 14 is the VORTAC — a combined VHF Omnidirectional Range (VOR) and UHF Tactical Air Navigation (TACAN) facility. It provides both bearing information (from the VOR component) and distance information (from the TACAN component). Symbol 13 is the standalone VOR. Symbol 5 is an NDB. Mnemonic: VOR=13, VORTAC=14 — consecutive numbers.
Q7Which is the symbol for a VOR?
Symbol 13 is the VOR. The VOR symbol is traditionally drawn with a compass rose around the station. Symbol 14 is the VORTAC. Symbol 5 is an NDB (Non-Directional Beacon, which transmits on MF/LF). Symbol 4 is a different aid category.
Q8What does symbol 3 represent?
Symbol 3 is an aeronautical ground light — a fixed light, often an aviation beacon, that assists pilots in visual navigation. An aeronautical ground light may be located at an aerodrome (the aerodrome beacon) or on prominent terrain. A lighthouse (b) is a marine navigational aid and uses a different, internationally standardised symbol. A VRP (c) uses a triangle or flag symbol.
Q9An aircraft flying VFR using visual navigation crosses two parallel roads at right angles to the track. For what purpose could that information be used?
When the aircraft crosses two parallel roads at right angles to track, it obtains two distinct position fixes separated by a known distance (the road spacing, read from the chart). If the pilot records the time taken to fly between the two roads, groundspeed can be calculated: GS = distance ÷ time. Crossing roads at right angles gives no heading information — you could be on exactly the correct track or significantly off it and still cross them at 90°.
Q10Which of the following would be most useful as a visual checkpoint when planning a flight?
A large motorway junction scores highly on all checkpoint criteria: very prominent at altitude, unique in shape (cloverleaf/trumpet interchanges are unmistakable), precisely definable position, permanent (motorway routes rarely change), and contrasting (grey concrete against surroundings). A small copse (a) is too small and not unique. A large wood (b) is better but changes over time. A river bend (d) is useful but many bends look similar; it is a secondary choice.
Quick Answer Key
Reinforce Chapter 7: Topographical Maps and Map Reading
Test your knowledge and practice actual exam questions for Air Navigation.