24
METEOROLOGY — CHAPTER 24 · NOTES
Station Model
by Ghost Aviator
Table of Contents
- 1. Introduction to Station Model
- 2. Station Model Layout & Parameter Positions
- 3. Meaning of Symbols — All Parameters
- 4. Present Weather (ww) Codes — Table 24.5/24.6/24.7
- 5. Cloud Codes — Low (CL), Medium (CM), High (CH)
- 6. Codes for h, RRR, VV (Table 24.4)
- 7. Total Cloud Amount (N) Coding
- 8. Worked Example — Decoding a Station Model
- 9. Practice Q&A
- 10. Master Reference Tables
1. Introduction to Station Model
Definition: A station model is a standardised symbolic representation of surface weather observations plotted on a synoptic weather chart. Each symbol, number, and code occupies a fixed position relative to a central circle that represents the observation station.
Met stations worldwide make standardised surface observations and encode them using WMO codes. These are then plotted as station models on synoptic charts used by forecasters and pilots. Reading a station model is a core DGCA exam skill.
🎯 Exam Tip: The station model is always tested in DGCA exams — usually 3–5 questions per paper. Memorise parameter positions, ww codes, and cloud symbol tables.
2. Station Model Layout & Parameter Positions
Standard Station Model Layout
| TT Temperature °C |
↗ | Wind ↓ ⊙ Station |
↖ | PPP Sea Level Pressure QFF (last 3 digits, tenths) |
| TdTd Dew Point °C |
ww (left) W₁W₂ (right) | PP Pressure Change in 3 hr / 10 |
||
| VV Visibility code 90–99 |
N circle (Total Cloud) |
a Pressure Tendency Symbol |
||
| CL Low Cloud type |
h Height of base of CL or CM |
RRR Rainfall since 01 UTC in code |
||
| CM Medium Cloud type |
Nh Amount of Low/Medium Clouds |
P1P2 Pressure Change in 24 hr |
||
| CH — High cloud type | GG — Time of observation (full hr UTC) | tsts — Sea Surface Temp | HwHw — Wave height | PwPw — Wave period | ||||
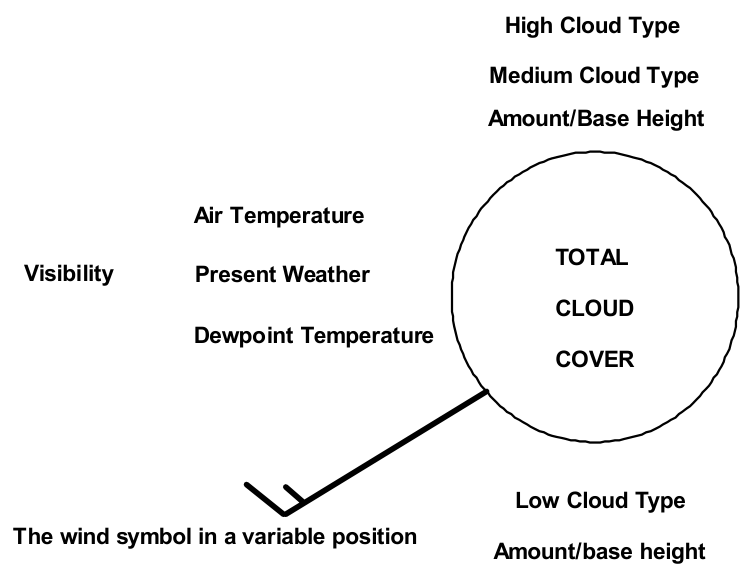
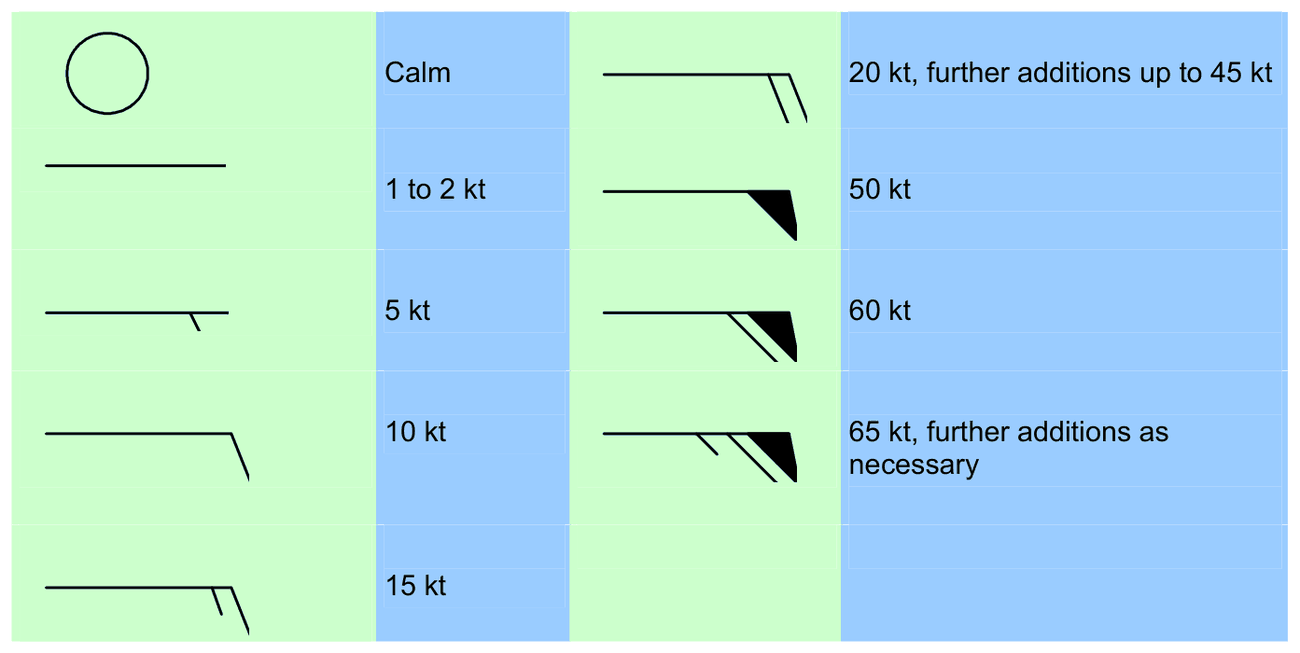
Complete Symbol Key
| Symbol | Parameter | Units / Description |
|---|---|---|
| TT | Temperature | °C |
| TdTd | Dew Point Temperature | °C |
| VV | Visibility | Code 90–99 (see Table 24.4) |
| ww | Present Weather | Code 00–99 (Table 24.5–24.7) |
| W₁W₂ | Past Weather | Symbols |
| PPP | Sea Level Pressure QFF | Last 3 digits (tenths of hPa); prefix 9 or 10 |
| RRR | Rainfall since 01 UTC | Code (see Table 24.4) |
| PP | Pressure Change in 3 hr | ÷ 10 (tenths of hPa) |
| a | Pressure Tendency Symbol | Rising/Falling/Steady etc. |
| tsts | Difference in Sea Surface Temp & TT | °C |
| HwHw | Height of First (swell) Wave | Repeated for subsequent waves |
| PwPw | Period of First Wave | Seconds |
| CH | Type of High Clouds | Code figure 0–9 |
| CM | Type of Medium Clouds | Code figure 0–9 |
| CL | Type of Low Clouds | Code figure 0–9 |
| N | Total Cloud Amount | Octas 0–9 (circle fill) |
| Nh | Amount of Low/Medium Clouds | Octas |
| h | Height of base of CL or CM | Code 0–9 (see Table 24.4) |
| GG | Time of Observation | Full hour UTC |
| P1P2 | Average Speed of Ship in 3 hr | Knots |
3. Main Symbols — ww Abbreviations
Key present weather symbols used in the simplified symbol table (Table 24.2):
| Symbol | Meaning | Symbol | Meaning |
|---|---|---|---|
| RA | Rain | DS | Dust Storm |
| DZ | Drizzle | FG | Fog |
| SN | Snow | SH | Shower |
| TS | Thunderstorm | GR | Hail (Grains) |
| BR | Mist | HZ | Haze |
| FU | Smoke | SA | Sand |
| PO | Dust/Sand Whirl | SS | Sandstorm |
| IC | Ice Crystals | PE | Ice Pellets |
| BLSN | Blowing Snow | DRSN | Drifting Snow |
| FZRA | Freezing Rain | FZDZ | Freezing Drizzle |
Past Weather Codes W₁W₂ (simplified):
| Code | W₁ or W₂ |
|---|---|
| 0 | Cloud Cover <4/8 |
| 1 | Cloud Cover >4/8 |
| 2 | Cloud Cover throughout |
| 3 | DS (Dust Storm) |
| 4 | FG (Fog) |
| 5 | DZ (Drizzle) |
| 6 | RA (Rain) |
| 7 | SN (Snow) |
| 8 | SH (Shower) |
| 9 | TS (Thunderstorm) |
4. Present Weather (ww) Code Tables
ww Code Ranges:
- 00–19 — No precipitation at station at time of observation
- 20–29 — Weather during last hour but NOT at time of observation
- 30–39 — DS, SS or blowing SN at time of observation
- 40–49 — Fog at time of observation
- 50–59 — Drizzle at time of observation
- 60–69 — Rain at time of observation
- 70–79 — Solid precipitation (Snow etc.) at time of observation
- 80–89 — Shower at time of observation
- 90–99 — Thunderstorm with precipitation at time of observation
flowchart TD
    A[ww Code] --> B{Range?}
    B -->|00-19| C[No precip at station\nSimple weather states]
    B -->|20-29| D[Precip last hour\nNOT now]
    B -->|30-39| E[Dust/Sand/Blowing Snow\nNOW]
    B -->|40-49| F[FOG now]
    B -->|50-59| G[DRIZZLE now]
    B -->|60-69| H[RAIN now]
    B -->|70-79| I[SOLID precip\nSnow/Ice now]
    B -->|80-89| J[SHOWER now]
    B -->|90-99| K[THUNDERSTORM\nwith precip now]
Key ww Codes to Memorise
| ww | Present Weather | ww | Present Weather |
|---|---|---|---|
| 00 | No Cloud | 50 | Slight intermittent drizzle |
| 01 | Clouds decreasing | 51 | Slight continuous drizzle |
| 02 | Clouds unchanged | 52 | Moderate intermittent drizzle |
| 03 | Clouds increasing | 53 | Moderate continuous drizzle |
| 04 | Smoke haze | 54 | Heavy intermittent drizzle |
| 05 | Moist haze | 55 | Heavy continuous drizzle |
| 06 | Dust haze | 60 | Slight intermittent rain |
| 07 | Dust raising winds | 61 | Slight continuous rain |
| 08 | Dust devil | 63 | Moderate continuous rain |
| 09 | Distant sandstorm | 65 | Heavy continuous rain |
| 10 | Mist | 80 | Slight shower |
| 11 | Shallow fog in patches | 81 | MOD/HVY shower |
| 12 | Shallow fog | 82 | Violent shower |
| 13 | Lightning | 83 | Slight shower with snow |
| 14 | Rain not reaching ground | 85 | Slight snow shower |
| 17 | Thunderstorm without rain | 89 | Slight SH of GR without TS |
| 18 | Squall | 90 | MOD/HVY SH GR after TS ceased |
| 19 | Funnel cloud | 91 | Slight RA after TS ceased |
| 20 | Drizzle (last hour) | 95 | Light TS with RA |
| 21 | Rain (last hour) | 96 | Light TS with GR |
| 22 | Snow (last hour) | 97 | HVY TS with RA/SN |
| 28 | Fog (last hour) | 98 | TS and DS |
| 29 | Thunderstorm (last hour) | 99 | HVY TS with GR |
⚠ Critical Distinction: Codes 20–29 mean the weather occurred during the last hour but is NOT present at the time of observation. Codes 50–99 mean the weather IS occurring at the time of observation.
5. Cloud Codes — CL, CM, CH
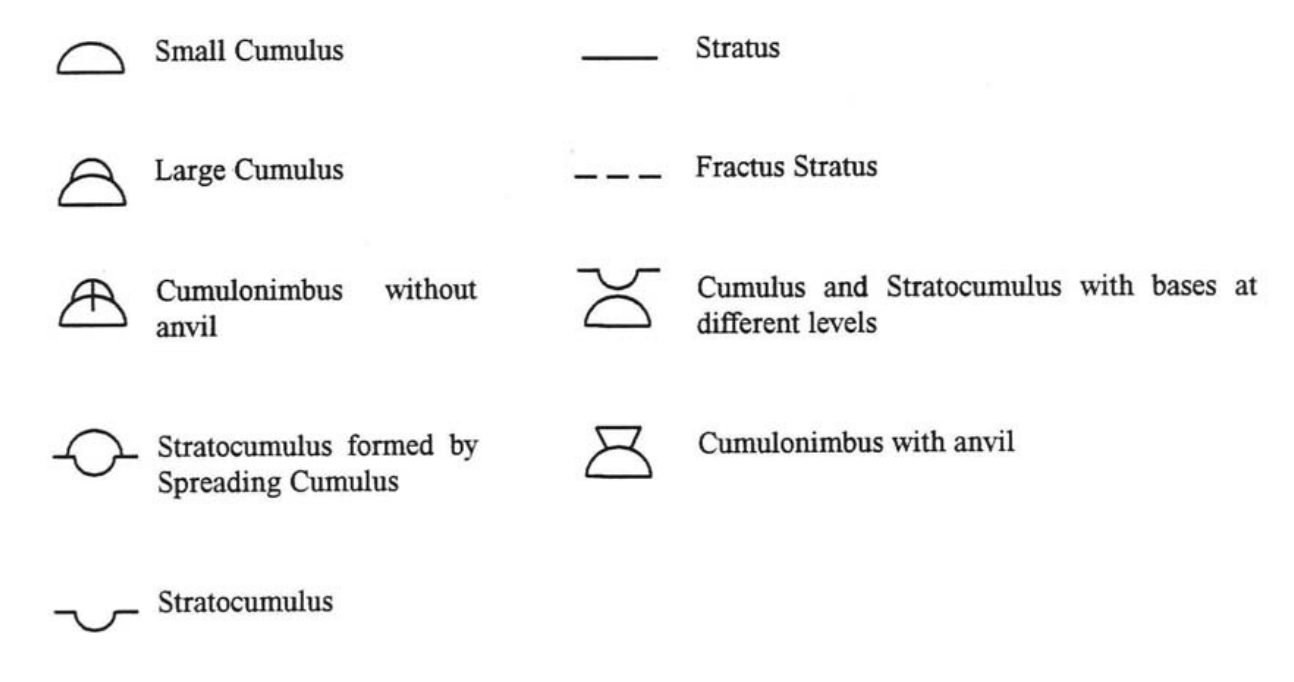
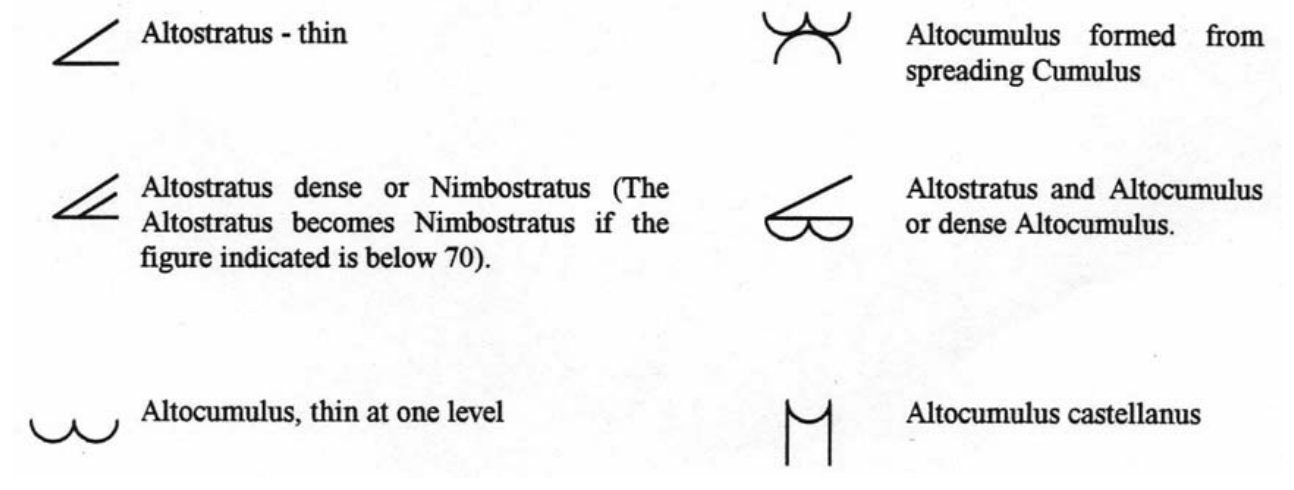
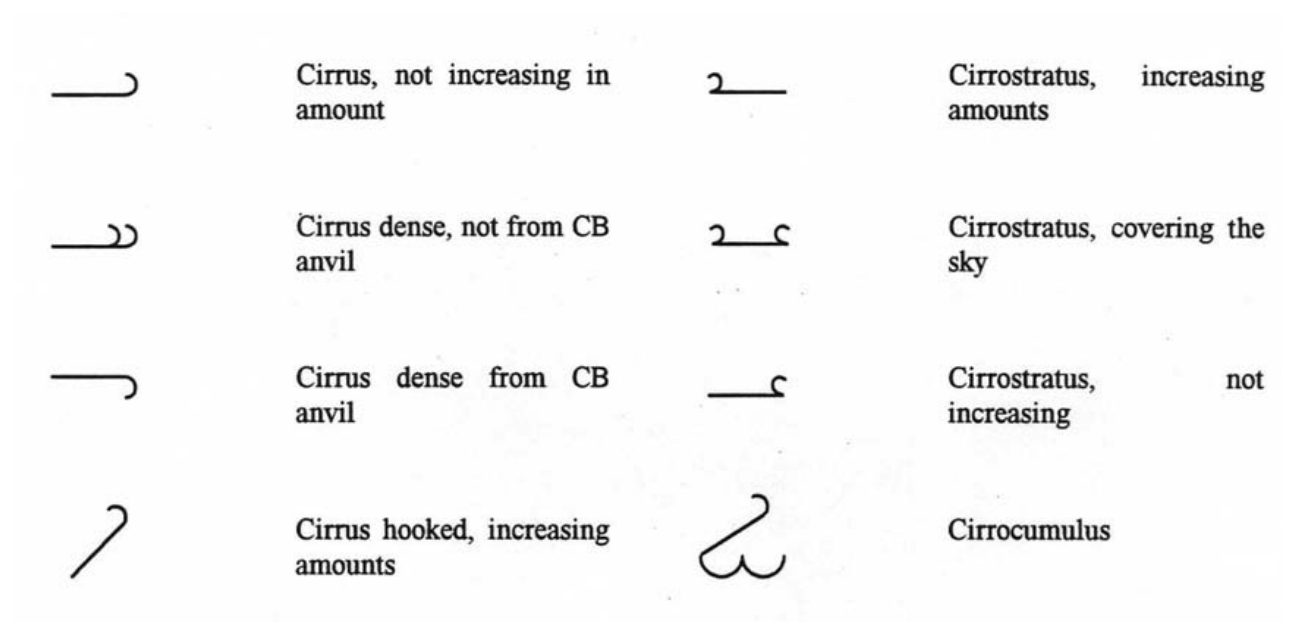
Low Clouds (CL)
| Code | Kind of Low Cloud |
|---|---|
| 0 | No low cloud |
| 1 | Fair weather Cumulus (CU) |
| 2 | CU of large vertical development |
| 3 | CB without anvil |
| 4 | Stratocumulus (SC) with CU with bases at same level |
| 5 | Stratocumulus (ST of fair weather) |
| 6 | ST of fair weather |
| 7 | ST of bad weather |
| 8 | SC and CU at different levels |
| 9 | CB with anvil |
Medium Clouds (CM)
| Code | Kind of Medium Cloud |
|---|---|
| 0 | No medium cloud |
| 1 | Thin AS |
| 2 | Thick AS or NS |
| 3 | AC at single level |
| 4 | AC at different level |
| 5 | AC in bands; Thickening and Spreading |
| 6 | AC resulting from spreading of CU |
| 7 | AC with AS or NS |
| 8 | AC with turreted structure |
| 9 | AC in chaotic sky |
High Clouds (CH)
| Code | Kind of High Cloud |
|---|---|
| 0 | No high cloud |
| 1 | Cirrus in filaments |
| 2 | Dense Cirrus |
| 3 | Dense CI remnant of dissipated CB |
| 4 | CI becoming denser |
| 5 | CI and CS and progressively increasing |
| 6 | CI and CS progressively increasing covering most of the sky |
| 7 | CS covering entire sky |
| 8 | CS not covering entire sky |
| 9 | CC predominate |
Mnemonic — Cloud Codes:
CL: "No Fair Big CB Strato-Strato Bad Mixed Anvil" (0→9)
CM: "No Thin Thick Single Different Bands Spread+NS Turret Chaotic" (0→9)
CH: "No Fil Dense CBremnant Denser CI+CS Most All NotAll CC" (0→9)
CL: "No Fair Big CB Strato-Strato Bad Mixed Anvil" (0→9)
CM: "No Thin Thick Single Different Bands Spread+NS Turret Chaotic" (0→9)
CH: "No Fil Dense CBremnant Denser CI+CS Most All NotAll CC" (0→9)
6. Codes for h, RRR, and VV (Table 24.4)
| h code | Cloud Base (m) | RRR code | Rain Amount (mm) | VV code | Visibility (m) |
|---|---|---|---|---|---|
| 0 | 0–49 | 0 | Nil | 90 | < 50 (Very Thick FOG) |
| 1 | 50–99 | … | Trace | 91 | 50 to <200 (THICK FOG) |
| 2 | 100–199 | — | Trace | 92 | 200 to <500 (MOD FOG) |
| 3 | 200–299 | 1 | 1–1.5 | 93 | 500 to <1000 (FOG) |
| 4 | 300–599 | 2 | 1.6–2.4 | 94 | 1000 to <2000 (THICK MIST) |
| 5 | 600–999 | 3 | 2.5–3.5 | 95 | 2000 to <4000 (SLIGHT MIST) |
| 6 | 1000–1499 | 4 | 3.6–4.4 | 96 | 4000 to <10000 |
| 7 | 1500–1999 | 5 | 4.5–5.5 | 97 | 10000 to <20000 |
| 8 | 2000–2500 | 6 | 5.6–6.4 | 98 | 20000 to <50000 |
| 9 | No Cloud below 2500 | 7 | 6.5–7.5 | 99 | 50000 or more |
| / | Base not known / Or below hill Stn. | 8 | 7.6–8.4 | — | — |
| — | — | 9 | further extrapolate values | — | — |
⚠ Note on VV Codes: VV code 90 = visibility <50 m (very thick fog). VV code 99 = 50 km or more. The scale is NOT linear — memorise the breakpoints.
⚠ Note on h code: h code / (slash) means cloud base is either not known, or station is below cloud base on a hill.
7. Total Cloud Amount (N) Coding
N is coded in Octas (eighths of sky covered) and plotted by filling the central station circle:
| Octas (N) | Sky Cover | Symbol |
|---|---|---|
| 0 | Clear | Open circle ○ |
| 1 | 1/8 | Circle with small wedge |
| 2 | 2/8 (1/4) | Circle, quarter filled |
| 3 | 3/8 | Circle, 3/8 filled |
| 4 | 4/8 (1/2) | Half-filled circle |
| 5 | 5/8 | 5/8 filled |
| 6 | 6/8 (3/4) | 3/4 filled |
| 7 | 7/8 | Almost full |
| 8 | Overcast | Fully filled ● |
| 9 | Sky obscured | × symbol |
| / | Data not available | Diagonal slash |
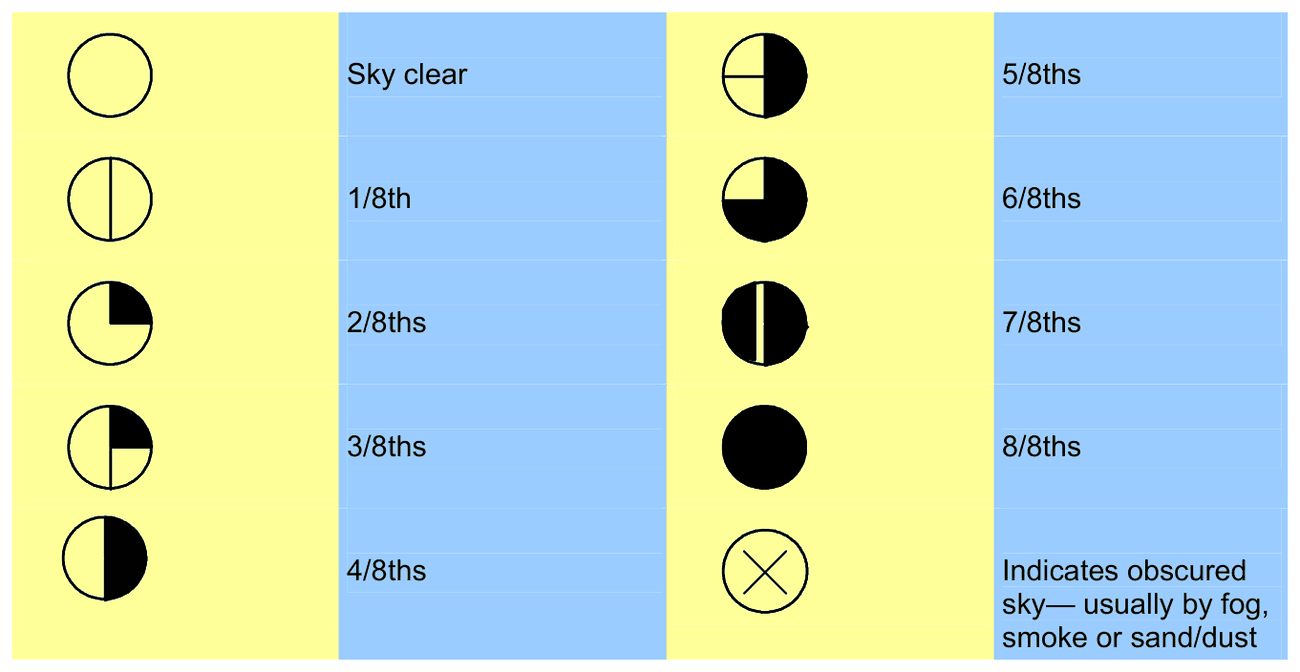
Exam Tip: N = 9 means sky is obscured (fog, smoke etc.) — not overcast! N = 8 is overcast. The / symbol means data not available.
8. Worked Example — Decoding a Station Model
Given Station Plot (from textbook Example):
    Wind: 330/15 kt (barb NNW, 15 kt)
         34    ↗    998
         93 ●      15
         27   3/2    …
| Reading | Parameter | Decoded Value |
|---|---|---|
| Wind barb direction + speed | Wind Direction & Speed | 330°/15 kt |
| 34 (top left) | Temperature (TT) | 34°C |
| 93 (middle left) | Visibility (VV code) | Code 93 → 500 to <1000 m (FOG) |
| 27 (bottom left) | Dew Point (TdTd) | 27°C |
| 998 (top right) | Sea Level Pressure QFF | 999.8 hPa (prefix 9 as >950) |
| 15 (middle right, small) | Pressure change in 3 hr | +1.5 hPa |
| ● (filled circle) | Total Cloud Amount (N) | 8/8 Overcast |
| 3/2 (below circle) | h / Nh | h=3 → cloud base 200–299 m; Nh=2 |
| ww symbol (●) left | Present Weather | FOG at observation |
| Past Weather (right) | W₁W₂ | Fog in past |
Complete Decoding of Worked Example:
Wind Direction & Speed: 330°/15 kt | Temperature: 34°C | Type of Low Clouds: Fracto Stratus | Visibility: 500m but not 1000m | Amount of Low Clouds: 3/8 | Present Weather: Weather Fog | Height of base of Low Clouds: 100–199 m | Dew Point: 27°C | Sea Level Pressure QFF: 999.8 hPa | Pressure Change in 3 hr: +1.5 hPa | Past Weather: Fog | Total Cloud Amount: 8/8 | Type of High Clouds: AS/NS | Rainfall since 01 UTC: 1.5 hPa pressure change
Wind Direction & Speed: 330°/15 kt | Temperature: 34°C | Type of Low Clouds: Fracto Stratus | Visibility: 500m but not 1000m | Amount of Low Clouds: 3/8 | Present Weather: Weather Fog | Height of base of Low Clouds: 100–199 m | Dew Point: 27°C | Sea Level Pressure QFF: 999.8 hPa | Pressure Change in 3 hr: +1.5 hPa | Past Weather: Fog | Total Cloud Amount: 8/8 | Type of High Clouds: AS/NS | Rainfall since 01 UTC: 1.5 hPa pressure change
Pressure Decoding Rule
PPP = Last 3 digits of pressure in tenths of hPa
Rule: If PPP > 500 → prefix 9 (e.g., 996 → 999.6 hPa)
If PPP ≤ 500 → prefix 10 (e.g., 024 → 1002.4 hPa)
Example: PPP = 962 → 996.2 hPa (prefix 9)
Example: PPP = 024 → 1002.4 hPa (prefix 10)
Rule: If PPP > 500 → prefix 9 (e.g., 996 → 999.6 hPa)
If PPP ≤ 500 → prefix 10 (e.g., 024 → 1002.4 hPa)
Example: PPP = 962 → 996.2 hPa (prefix 9)
Example: PPP = 024 → 1002.4 hPa (prefix 10)
Quick Rule: PPP > 500 → add 9 in front; PPP ≤ 500 → add 10 in front. Then divide the full 4-digit number by 10 to get hPa.
9. Practice Q&A
Based on the example station model: Wind 090/ω; TT=34, VV=●, Td=93, Nh=27, [circle=●], h/Nh=3/2, PPP=962, PP=15, ww=●, W₁W₂=…, 5×
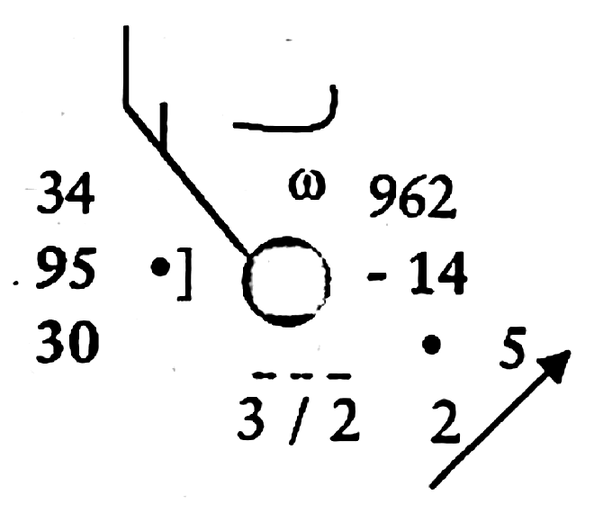
Figure 24.A Station model for Questions 1–20
Q1. The direction of surface wind is: (a) NW (b) NE (c) SE
✅ Answer: (a) NW — The wind staff is drawn from the north-west of the circle: the wind blows FROM the north-west.
❌ (b) NE and (c) SE point to the wrong side of the circle. The staff always points to the direction the wind comes FROM.
💡 Staff = where the wind comes FROM. The barbs give the speed.
Q2. The range of wind speed is: (a) 20–25 kt (b) 16–22 kt (c) 18–22 kt
✅ Answer: (c) 18–22 kt — The staff carries barbs that add up to 20 kt. A plotted wind speed is read as a band of about ±2 kt, so the speed lies in 18–22 kt.
❌ (a) 20–25 kt and (b) 16–22 kt are not centred on the plotted 20 kt.
💡 Count the barbs, then give the band around that speed.
Q3. The type of medium cloud is: (a) AC (b) AS (c) AC &AS
✅ Answer: (a) AC — The curved symbol above the circle is the altocumulus symbol for the medium cloud (CM) group.
❌ (b) AS and (c) AC & AS have different symbols in the CM table.
💡 Read the symbol, then find it in the CM table.
Q4. Low clouds are: (a) CU (b) SC (c) ST
✅ Answer: (c) ST — The dashed line under the circle is the stratus (ST) symbol for the low cloud (CL) group.
❌ (a) CU and (b) SC have their own symbols (a dome and a bar with scallops).
💡 Dashed line = stratus.
Q5. High clouds are: (a) CC (b) CI (c) CS
✅ Answer: (b) CI — The hooked curved line above the circle is the symbol for cirrus (CI) filaments, a high cloud (CH).
❌ (a) CC and (c) CS have different symbols in the high-cloud (CH) table.
💡 High cloud symbols are drawn above the circle; medium and low below it.
Q6. Height of base of low clouds is: (a) 200 m (b) 250 m (c) 100 to 199 m
✅ Correct Answer: (c) 100 to 199 m — h code 2 = 100–199 m
❌ h code 2 gives a RANGE, not a single value. (a) and (b) are specific values, not ranges.
💡 Always express h as a range per Table 24.4. Code 2 = 100–199 m.
Q7. Amount of lowest cloud is: (a) 2/8 (b) 4/8 (c) 3/8
✅ Answer: (c) 3/8 — The group under the circle reads 3/2: 3 is the amount of the lowest cloud in eighths (3/8) and 2 is its height code.
❌ (a) 2/8 uses the height code as the amount. (b) 4/8 is not plotted.
💡 Nh/h: amount first, then height code.
Q8. Dew Point temperature range is: (a) 29.5 to 30.4°C (b) 29.1 to 30.4°C (c) 30.6 to 30.4°C
✅ Answer: (a) 29.5 to 30.4°C — The dew point is plotted as 30. A plotted whole degree stands for the range from half a degree below to just under half a degree above: 29.5 to 30.4 °C.
❌ (b) 29.1 to 30.4 and (c) 30.6 to 30.4 are not valid rounding ranges.
💡 A reported whole degree covers −0.5 to +0.4.
Q9. Temperature 34°C is: (a) Dry (b) Wet (c) Dew Point
✅ Correct Answer: (a) Dry — TT (top left) is the dry bulb temperature
❌ (b) Wet bulb is not plotted on standard station model; (c) Dew Point is bottom left (TdTd).
💡 Station model convention: TOP LEFT = Dry temp; BOTTOM LEFT = Dew Point.
Q10. 962 represents: (a) QFE (b) QFF (c) QNH
✅ Correct Answer: (b) QFF — PPP on station model is always Sea Level Pressure = QFF
❌ QFE = aerodrome pressure; QNH = altimeter setting. Station model plots QFF (Mean Sea Level Pressure).
💡 Station model ALWAYS shows QFF (MSL pressure). PPP=962 → 996.2 hPa QFF.
Q11. Pressure value in hPa is: (a) 996 (b) 996.2 (c) 1096.2
✅ Correct Answer: (b) 996.2 hPa — PPP=962 → 9 prefix (since >500) → 9962 → ÷10 = 996.2
❌ (a) 996 misses the tenth; (c) 1096.2 uses wrong prefix.
💡 Rule: PPP > 500 → prefix 9. 962 > 500 → 9962 → 996.2 hPa.
Q12. Pressure change of 1.4 hPa is in: (a) 6 hr (b) 3 hr (c) 24 hr
✅ Correct Answer: (b) 3 hr — PP on station model = pressure change in 3 hours (÷10)
❌ The 24hr pressure change uses P₁P₂ field. PP field = 3hr change.
💡 PP = 3hr pressure change. Value plotted ÷10 = actual change. Here PP=15 → 1.5 hPa/3hr.
Q13. Past weather is: (a) Moderate Light Rain (b) Continuous Rain (c) Heavy Rain
✅ Correct Answer: (a) Moderate Light Rain — W₁W₂ symbols indicate past weather
💡 Past weather W₁W₂ appears to the RIGHT of the circle on the station model.
Q14. Rainfall amount is: (a) 2 mm (b) 1.5 mm (c) 1.6 to 2.4 mm
✅ Answer: (c) 1.6 to 2.4 mm — The rainfall is plotted as 2 mm, which stands for the band 1.6 to 2.4 mm.
❌ (a) a single value of 2 mm and (b) 1.5 mm are not the reported band.
💡 Plotted values stand for a band, not an exact figure.
Q15. Rainfall reported is from: (a) 0300Z yesterday to 0300Z today (b) 0100 to 2400Z today (c) 0530 to 0830 IST
✅ Correct Answer: (a) 0300Z yesterday to 0300Z today — RRR is "Rainfall since 01 UTC" but in some codes = 03Z previous day to 03Z current
💡 The tracker says "since 01 UTC" but the Q&A answer specifies 0300Z yesterday to 0300Z today — this reflects a 24hr accumulation period ending at 03Z.
Q16. Speed of Ship is: (a) 5 KMH (b) 5 MPS (c) 5 KT
✅ Correct Answer: (c) 5 KT — Ship speed on station model is in knots
❌ (a) KMH and (b) MPS are not used for ship speed on synoptic charts.
💡 All speeds on station model (wind + ship) are in KNOTS.
Q17. Direction of movement of Ship: (a) NW (b) SW (c) NE
✅ Answer: (c) NE — The arrow shows the direction in which the ship is moving, drawn towards the north-east.
❌ (a) NW and (b) SW do not match the arrow.
💡 The ship arrow points where the ship is going; the wind staff points where the wind comes from.
Q18. Speed of Ship reported is averaged for: (a) 3 hr (b) 6 hr (c) 12 hr
✅ Answer: (a) 3 hr — The ship's speed is the average over the last 3 hours.
❌ (b) 6 hr and (c) 12 hr are not the averaging period.
💡 Ship speed: 3-hour average.
Q19. Surface visibility is: (a) 500 to <1000 m (b) 1000 to 2000 m (c) 2000 to <4000 m
✅ Answer: (c) 2000 to <4000 m — The visibility code 95 stands for 2000 m to under 4000 m (code 94 is 1000–2000 m, 96 is 4000–10,000 m).
❌ (a) and (b) belong to codes 93 and 94.
💡 VV: 90 <50 m · 91 50–200 · 92 200–500 · 93 500–1000 · 94 1–2 km · 95 2–4 km · 96 4–10 km.
Q20. Weather reported is: (a) Rain at time of observation (b) Rain during last one hour (c) Rain not at station but within 5 km
✅ Correct Answer: (b) Rain during last one hour — ww code 21 = Rain last hour but NOT at time of observation
❌ (a) Rain at time of obs = ww 60–69; (c) Rain within 5km = not a standard station model category.
💡 ww 20–29 = weather in the PAST hour, not NOW. ww=21 specifically = Rain last hour.
10. Master Reference Tables
Quick Numerical Reference
| Parameter | Key Values |
|---|---|
| Pressure prefix rule | PPP > 500 → prefix 9; PPP ≤ 500 → prefix 10 |
| VV code 90 | < 50 m (Very Thick FOG) |
| VV code 93 | 500 to <1000 m (FOG) |
| VV code 95 | 2000 to <4000 m (Slight Mist) |
| VV code 99 | ≥50 km |
| h code 0 | 0–49 m |
| h code 2 | 100–199 m |
| h code 9 | No cloud below 2500 m |
| N = 9 (octas) | Sky obscured (not overcast) |
| N = 8 (octas) | Overcast |
| ww 20–29 | Weather in last hour only — NOT now |
| ww 50–59 | Drizzle now |
| ww 60–69 | Rain now |
| ww 90–99 | TS with precip now |
| PP (3hr change) | Divide plotted value by 10 to get hPa |
| Ship speed in this plotted model | In knots, averaged over 3 hours |
Mnemonic Sheet
STATION MODEL POSITION MNEMONIC: "TV → Wind → Press → Change"
Top-Left = Temperature (TT)
Bottom-Left = Td (Dew Point)
Left of circle = Visibility (VV) code
Left of circle (ww) = Present Weather
Right of circle = Past Weather (W₁W₂)
Top-Right = Pressure (PPP)
Middle-Right = Pressure change 3hr (PP)
Below circle = h / Nh
PPP RULE: ">500 → Nine; ≤500 → Ten" then ÷10 → hPa
ww RANGES: "No Fog Last-Hour Dusty Foggy Drizzy Rainy Snowy Showery Stormy" = 00 10 20 30 40 50 60 70 80 90
Top-Left = Temperature (TT)
Bottom-Left = Td (Dew Point)
Left of circle = Visibility (VV) code
Left of circle (ww) = Present Weather
Right of circle = Past Weather (W₁W₂)
Top-Right = Pressure (PPP)
Middle-Right = Pressure change 3hr (PP)
Below circle = h / Nh
PPP RULE: ">500 → Nine; ≤500 → Ten" then ÷10 → hPa
ww RANGES: "No Fog Last-Hour Dusty Foggy Drizzy Rainy Snowy Showery Stormy" = 00 10 20 30 40 50 60 70 80 90
Ghost Aviator
Study Meteorology with other student pilots
Join the free Meteorology group on Telegram. Stuck on a doubt? Type /q and your question, and get an answer from Ghost Aviator's notes.
LIVE BATCH
Study Aviation Meteorology live with the Captain
Small batch of 10 · live doubt-clearing · 4–6 weeks · ₹12,999 ₹7,999
Reinforce Chapter 24: Station Model
Test your knowledge and practice actual exam questions for Aviation Meteorology.
Planning your Pilot Training in 2026?
Calculate exact flying hours, DGCA exam fees, and living costs with our interactive calculator.