1. Weather Radar — Introduction
Weather Radar (Radio Detection and Ranging): An important tool for detection of rain-bearing clouds, especially CU and CB, their speed, direction of movement, and vertical extent. Used for issuing timely weather warnings so that precautionary measures are initiated for parked and moored aircraft. Radars along the coast line of India detect storms and enable issuing of storm warnings.
- IMD has used X-Band weather-cum-wind finding Multi Met Radars and Radiosonde system since 1975.
- Good network of S-band cyclone detection radars covering the Indian coast line.
- Operational network of digital X-band radars, including Doppler Weather Radars (DWR) for wind finding, storm detection, and dual capability — planned to be replaced by state-of-the-art DWR in a phased manner.
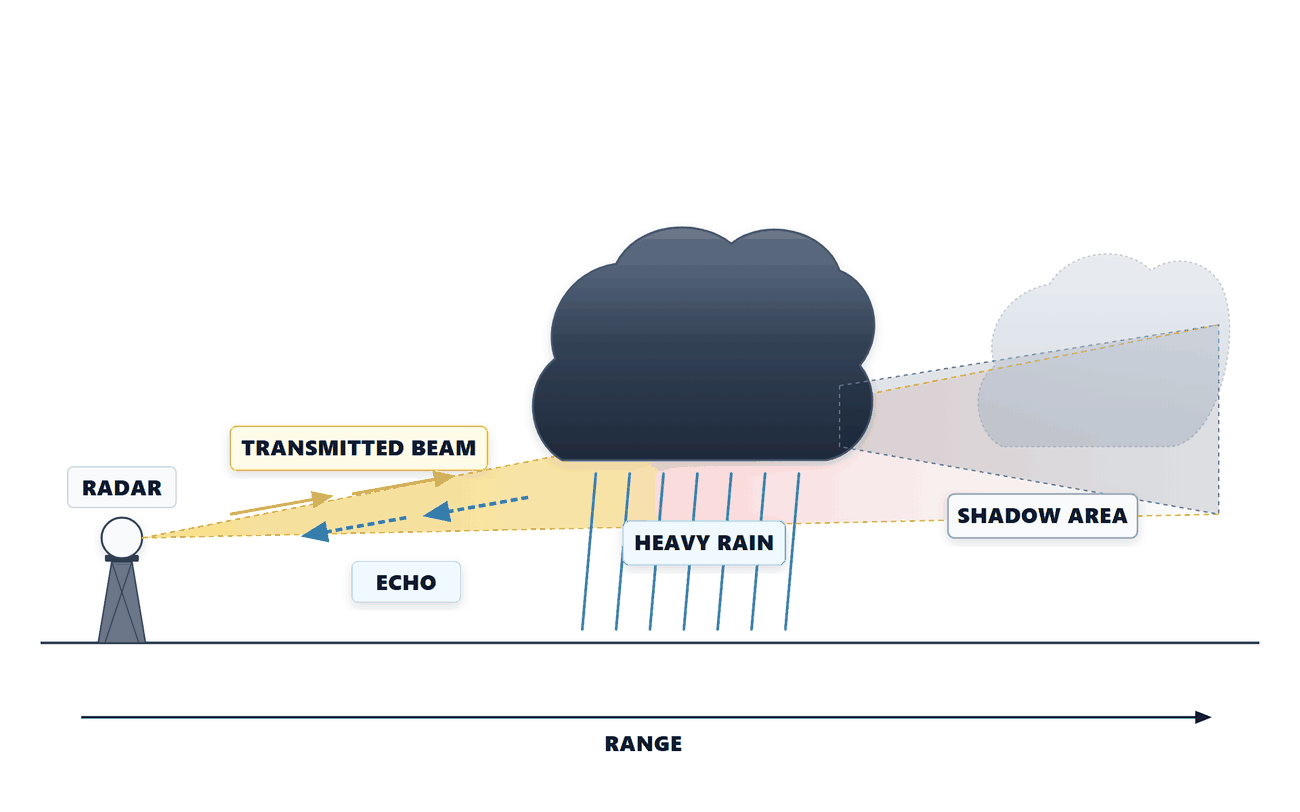
Range: Limited by attenuation of radar waves by rain and earth curvature effect.
- Weather radars can detect up to a range of 500 km, but resolution is better up to a range of 250 km.
- Normally echoes from range within 25 NM are displayed.
- Echoes at long range up to 75 NM are also used.
2. Radar Scopes
| Scope | Full Name | Function |
|---|---|---|
| PPI | Plan-Position Indicator | Presents a plan view of the echoes; provides the bearing and range of the echo |
| RHI | Range-Height Indicator | Enables direct reading of the altitudes of CB cells |
3. Radar Wavelengths and Bands
| Wavelength | 0.75–2.5 cm | 2.5–4 cm | 4–8 cm | 8–15 cm | 15–30 cm |
|---|---|---|---|---|---|
| Band | K Band | X Band | C Band | S Band | L Band |
Band Uses:
- K and X Band: Used for detection of clouds.
- X Band: Used for storm detection.
- S Band: Used for rain, precipitation, cyclones, and depressions. Also called Cyclone Detection (and tracking) Radar.
4. Types of Weather Radars
| Type | Wavelength | Purpose |
|---|---|---|
| Quantitative Radar | 10.0 cm | Quantitative measurement of rate of precipitation, total precipitation, intensity of precipitation, and snowfall measurements |
| Ultra Sensitive Radar | — | Detecting convection before and after cloud development; study CAT, gravity waves, and lee waves |
| Doppler Weather Radar (DWR) | — | State-of-art; Doppler Effect; wind finding, storm detection, dual capability |
5. Doppler Weather Radar (DWR)
DWR is a state-of-art Radar that works on the principle of Doppler Effect and measures change of frequency of the return signal to determine if targets are moving towards or away from the radar station. It is a coherent radar; detects the pulse difference between outgoing and return pulses.
- A radar beam's reflectivity depends on the diameter of the target and its capacity to reflect.
- Snowflakes are large but weakly reflective; rain drops are small but highly reflective.
- When snow falls through a layer above freezing temperature, it melts; snowflakes become coated with water and radar sees them as very large droplets — can be mistaken for stronger precipitation. On PPI: shows up as an intense ring of precipitation — Bright Band at the altitude where the beam crosses the melting level.
- Drizzle does not show up on radar — radar returns are proportional to the sixth power of droplet diameter.
DWR is used for the following:
- (a) Prediction of: TS/DS/SS, Hailstorm and Tornadoes, HVY rainfall and floods
- (b) Tracking of: Cyclones and TS, and estimation of associated winds
- (c) Study of structure of: Clouds, Cyclones, TS, Hailstorm, Tornadoes
- (d) Detection of: Wind Shear and Turbulence, CAT, Gust Front, Microburst, Downburst and Tornadoes
- (e) Genesis of: Tornadoes
- (f) Determination of: Vertical Wind field and Horizontal Divergence field
Additional Radar Facts:
- Most modern weather radars utilise a pulse-Doppler technique for estimating precipitation rate, droplet motion with respect to the radar, and radial wind speeds.
- More recently, dual polarized weather radars have been developed that enable more accurate determination of precipitation types and sizes.
6. Cloud Echoes and Echo Characteristics
Stratiform Cloud Echoes
- Echoes from Stratiform clouds and steady rainfall are diffused and ill-defined; generally of uniform intensity.
- Bright Band: Appears in the RHI at freezing level; due to strong reflection of radio waves by ice crystals (snowflakes in initial stage of melting); seen only when updraughts are uniform and weak; band disappears with increasing convection. Bright Band is an indicator of weak storm; a few hundred metres thick; seen just below the freezing level in stratiform precipitation.
Convective Cloud Echoes
- Clearly defined sharp edges.
- Blurring of edges = first sign of decay.
- In RHI: consists of one or more sharp-edged vertical levels.
- Developing shower areas distinctly visible in the echo.
- Squall lines depicted by line of echoes.
- If echo is exceptionally intense OR top extends to about −40°C temperature level = CB cloud.
7. Echoes Associated with Severe Storms
| Echo Type | Significance |
|---|---|
| Intense and Sharp Echoes | Updraughts strong; large number of precipitation particles; developing storm = sharp boundary near top; Anvils = fuzzy echoes near the top |
| Hooks, Appendages and Protuberances | Severe storms with hail; echo of figure '6' = indication of a tornado |
| Rapidly Moving Echoes | Strong winds associated with severe storms |
| Wind Shear | Showers seen as separate columns of rain; slant vertical columns represent vertical wind shear |
| Dry Holes | Echo-free areas embedded in very extensive and bright echo = severe storms with strong winds and heavy rain |
| Rapidly Developing Echoes | Indicate a vigorous storm |
| Large Horizontal Echoes | Large size strong echo = severe storm |
| Converging Echoes | Number of echoes appearing to converge = severe storm |
| Bright Band | A few hundred metres thick; indicator of WEAK storm; just below freezing level; in stratiform precipitation |
| Spiral Bands | Indicate tropical cyclones; last for a long time |
Critical Distinction — Bright Band: Bright Band = WEAK storm indicator. This is counter-intuitive! It appears at the freezing level in stratiform (not convective) precipitation. It disappears with increasing convection. A Bright Band means the storm is NOT intense.
8. Airborne Weather Radar
- Light weight, generally X-Band, multi mode, digital with Alpha Numeric.
- Operate on super high frequency band; wavelength between X and S bands.
- Designed for: Weather detection and analysis, Ground mapping, Transponder beacon interrogation and reception.
- Radar beam: conical, approximately 3 degrees wide, moving in azimuth 15 degrees up and down.
- Radar screen covers 70 degrees either side of aircraft heading.
- Large drops and hail adequately reflect at 3 cm wavelength.
- Four colors: Green, Yellow, Red, Magenta (bright crimson).
- Colors show progressively stronger echoes; provision to flash red areas on and off every ½ sec to emphasise areas of heavy precipitation.
🔴 RED / MAGENTA: Heavy precipitation, TS, hail, strong winds, tornadoes and severe turbulence. Aircraft should ALWAYS AVOID. Rainfall: ≥12 mm
🟡 YELLOW: Moderate precipitation, very low visibility, moderate turbulence, uncomfortable ride for passengers. Aircraft should AVOID going through. Rainfall: 4–12 mm
🟢 GREEN: Light precipitation, little to no turbulence, reduced visibility. Rainfall: 1–4 mm
Rainfall Intensity Table
| Colour | Storm Intensity | Rainfall in mm |
|---|---|---|
| Red (Magenta) | Severe (Very strong signal) | ≥12 |
| Yellow | Less severe (Mod intensity signal) | 4–12 |
| Green | Moderate (Low intensity signal) | 1–4 |
9. Meteorological Satellites
flowchart LR
    S["Met Satellites"] --> P["(a) Polar Orbiting\nAlt: 650–1500 km\nCovers earth twice in 24 hr\nSame place every 12 hr\nExample: NOAA"]
    S --> G["(b) Geostationary\nAlt: ~36,000 km\nEarth's equatorial plane\nEarth synchronized\nSame spot always\n5 cover entire globe\nRound-the-clock weather\nExample: METEOSAT, INSAT"]
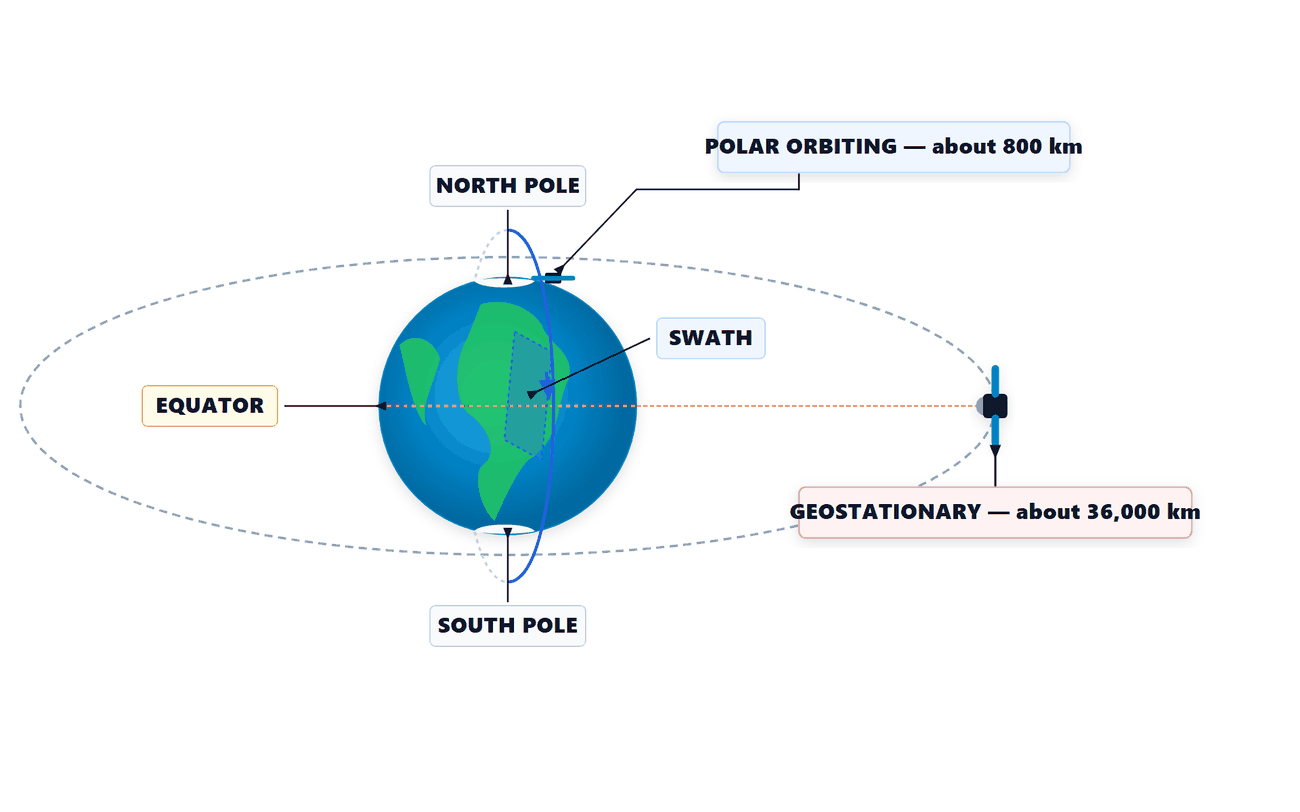
| Parameter | Polar Orbiting | Geostationary |
|---|---|---|
| Altitude | 650–1500 km | ~36,000 km |
| Earth coverage | Complete earth twice in 24 hr | Same spot always |
| Same point revisit | Every 12 hr | Continuous |
| Number for global coverage | Multiple | 5 satellites |
| Weather info | Periodic | Round the clock |
| Examples | NOAA | METEOSAT, INSAT |
Frequency of Satellite Imagery: Interval of observations = 30 min; however due to licensing and other restrictions, these satellites provide three hourly pictures.
10. Indian Meteorological Satellites
| Satellite | Launch Date | Position | Key Features |
|---|---|---|---|
| Kalpana-1 | 12 September 2002 | 74°E | 3 channel VHRR: VIS (0.55–0.75 μm), IR (10.5–12.5 μm), WV (5.7–7.1 μm); VIS res 2×2 km; ~48 images/day; 5 times during daytime only |
| INSAT-3A | 10 April 2003 | 93.5°E | 3 channel VHRR + CCD payload for VIS/Near IR/Short Wave IR; Resolution 1×1 km; 9 images/day; hydrometeorological data collection; Indian Area coverage 44.4°N to 10.3°S, 105.6E to 46.4E |
| INSAT-2E | — | — | Cloud imagery in panchromatic VIS band; 2×2 km WV map; TIR images; BV and IR 8×8 km; CCD board |
| METSAT | — | — | Satellite pictures every 3 hours commencing 0300 UTC; processed by SDUC in ~40 min; received at ~0415Z; In cyclones — hourly observations provided |
| INSAT-3D | 25 July 2013 | 82°E | Advanced weather satellite of ISRO; launched from French Guiana Space Centre; 1 km MIR and Thermal IR; 4 km SWIR; 8 km WV; storm warning system; vertical profiles of temp/humidity |
| INSAT-3DR | 08 September 2016 | 74°E | Operational Met satellite; images in VIS/IR/WV; resolution 1km, 4km, 8km |
INSAT-3D & INSAT-3DR (together):
- Two operational Met satellites; image earth in VIS, IR, and WV bands.
- Resolution: 1 km VIS, 4 km IR, 8 km WV.
- Located at 74°E; provide 48 passes daily.
- After every 15 minutes a new set of images/products available to forecasters.
- Scan Indian land region every hour; scan Indian Ocean region every 90 minutes.
- Inter-change their scan areas after every 3-hour interval to get temperature and humidity profiles.
- Processed data: Sea Surface Temperature (SST), Outgoing Long Wave Radiation, Rainfall Estimation, Cloud Motion Vectors, Water Vapour Vector, Upper Tropospheric Humidity.
METSAT: Receives and processes satellite pictures every 3 hours, commencing 0300 UTC. Processed by SDUC in about 40 min. Imagery received after 1 hr 15 min (i.e. 0300Z picture received by 0415Z). In event of cyclones: hourly observations are provided. Animation of hourly and 3-hourly satellite pictures also available on the website.
OCEANSAT-2 (ISRO): Data utilised for Tropical Cyclone genesis and NWP models.
Foreign Satellites
| Satellite | Country/Org | Type | Key Info |
|---|---|---|---|
| NOAA (K, L, M) | USA / NOAA | Polar (POES) | Daily global coverage of clouds, storm location, temperature, heat balance; 3 ground processing systems at IMD New Delhi, RMC Chennai, RMC Guwahati |
| METEOSAT | EUMETSAT | Geostationary | Near 0° meridian; operated by EUMETSAT on behalf of European Met Agencies |
| GMS | Japan | Geostationary | At 130°E |
| INSAT | India | Geostationary | At 83° and 93° |
| GOES | USA | Geostationary (GOES) | 2 satellites (East and West coast); provides temp data every hour; interval ~30 min |
Computer-generated output from Indian Satellites:
- (a) Vertical temperature and humidity profile
- (b) Cloud top and SST (Sea Surface Temperature)
- (c) Upper winds
- (d) Convective clouds and Mesoscale systems
11. Cloud Characteristics in Satellite Imagery
| Feature | Appearance in Satellite Imagery |
|---|---|
| Clouds (general) | White and gray; cast dark shadows on ground; thicker clouds and water clouds are brighter than ice clouds |
| High clouds (detectable) | Detectable only by the shadow they cast |
| CU clouds | Great variety, organized into small regular lines or bands |
| Jet stream clouds | Very long streaks; high cirrus clouds |
| Smoke | Brown to grey; from oil fires = black |
| Haze | Featureless and pale gray or whitish |
| Dust | Slightly tan (like soil); can be white, red, dark brown, even black (due to mineral content) |
| Volcanic plumes | Steam and gas = white; ash = brown |
In IR Imagery:
- Lowest temperatures = Whitest (high cold cloud tops appear bright white)
- Warmest = Dark grey or black (warm surface, clear areas)
Quick Revision Summary — Radar
- PPI = plan view (bearing/range); RHI = height view (CB altitude)
- Bands: K(0.75–2.5cm), X(2.5–4cm), C(4–8cm), S(8–15cm), L(15–30cm)
- K+X = clouds; X = storms; S = cyclone detection/tracking; Quantitative radar = 10 cm
- DWR = Doppler; measures frequency change; coherent radar
- Radar range: detect 500 km, best resolution 250 km, display 25 NM, long range 75 NM
- Bright Band = WEAK storm; at freezing level; stratiform only; disappears with convection
- Figure '6' echo = tornado; Spiral bands = tropical cyclone
- Dry Holes = severe storms (strong winds + heavy rain)
- Airborne: X-Band, 3° beam, 15° up/down, 70° coverage, 3cm wavelength, ½ sec flash
- Colors: Green=light(1–4mm), Yellow=moderate(4–12mm), Red/Magenta=severe(≥12mm)
- Drizzle NOT shown on radar (returns ∝ 6th power of droplet diameter)
- Polar: 650–1500 km; covers earth 2×/day; same spot every 12 hr; e.g. NOAA
- Geostationary: ~36,000 km; earth-synchronized; 5 cover globe; round-the-clock; e.g. INSAT, METEOSAT
- Satellite imagery interval: 30 min; but pictures provided: 3 hourly
- Kalpana-1: launched 12 Sep 2002 at 74°E; 48 images/day (daytime only)
- INSAT-3A: launched 10 Apr 2003 at 93.5°E; 1×1 km resolution
- INSAT-3D: launched 25 Jul 2013 at 82°E; INSAT-3DR: 08 Sep 2016 at 74°E
- INSAT-3D/3DR: 48 passes/day; new image every 15 min; land scan every 1 hr; ocean every 90 min
- METSAT: pictures every 3 hr from 0300 UTC; in cyclones: hourly
- IR imagery: coldest = whitest; warmest = darkest
Practice Q&A
Q1. PPI scope provides:
(a) Plan view of echoes — bearing and range (b) Height of echoes (c) Intensity of echoes
(a) Plan view of echoes — bearing and range (b) Height of echoes (c) Intensity of echoes
✅ Correct Answer: (a) Plan view of echoes — bearing and range
The Plan-Position Indicator (PPI) presents a plan (top-down) view of echoes and provides the bearing and range of the echo.
The Plan-Position Indicator (PPI) presents a plan (top-down) view of echoes and provides the bearing and range of the echo.
❌ (b) Height of echoes: This is the function of the RHI (Range-Height Indicator) scope. ❌ (c) Intensity: While colour-coded intensity may be shown, the defining feature of PPI is plan view with bearing/range.
🎓 PPI = Plan (horizontal) = Position = Bearing/Range. RHI = Range-Height = Altitude of CB cells. Easy: "RHI reads Height."
Q2. RHI scope enables direct reading of:
(a) Speed of echoes (b) Range of echoes (c) Altitude of CB cells
(a) Speed of echoes (b) Range of echoes (c) Altitude of CB cells
✅ Correct Answer: (c) Altitude of CB cells
The Range-Height Indicator (RHI) enables direct reading of the altitudes of CB cells — essential for aviation weather avoidance decisions.
The Range-Height Indicator (RHI) enables direct reading of the altitudes of CB cells — essential for aviation weather avoidance decisions.
🎓 RHI = Range-Height Indicator. Direct reading of CB cell altitude = pilots can decide if they can overfly the CB or need to deviate.
Q3. S band radar is used for:
(a) Detection of clouds (b) Storm detection (c) Cyclone detection and tracking (rain, precipitation, cyclones)
(a) Detection of clouds (b) Storm detection (c) Cyclone detection and tracking (rain, precipitation, cyclones)
✅ Correct Answer: (c) Cyclone detection and tracking
S band (8–15 cm wavelength) is used for rain, precipitation, cyclones, and depressions. It is also called the Cyclone Detection (and tracking) Radar.
S band (8–15 cm wavelength) is used for rain, precipitation, cyclones, and depressions. It is also called the Cyclone Detection (and tracking) Radar.
❌ (a) K and X Band = cloud detection. ❌ (b) X Band = storm detection. S Band is specifically the cyclone band.
🎓 "S for Sea/Storm/Cyclone" — S band covers the longest range for weather, best for cyclone tracking. IMD's cyclone detection network uses S-band radars along the coast.
Q4. Quantitative Radar measures rate of precipitation using wavelength:
(a) 5.0 cm (b) 10.0 cm (c) 3.2 cm
(a) 5.0 cm (b) 10.0 cm (c) 3.2 cm
✅ Correct Answer: (b) 10.0 cm
Quantitative Radar (10.0 cm wavelength) is used for quantitative measurement of rate of precipitation, total precipitation, intensity, and snowfall.
Quantitative Radar (10.0 cm wavelength) is used for quantitative measurement of rate of precipitation, total precipitation, intensity, and snowfall.
🎓 Quantitative Radar = 10 cm. Remember: 10 cm is in the S-Band range (8–15 cm). Airborne weather radar = 3 cm (X-Band).
Q5. DWR detects if targets are moving towards or away by measuring:
(a) Amplitude of return signal (b) Change of frequency of return signal (c) Time delay of return signal
(a) Amplitude of return signal (b) Change of frequency of return signal (c) Time delay of return signal
✅ Correct Answer: (b) Change of frequency of return signal
DWR works on the principle of the Doppler Effect — measuring the change of frequency of the return signal to determine if targets (precipitation, wind, etc.) are moving towards or away from the radar station.
DWR works on the principle of the Doppler Effect — measuring the change of frequency of the return signal to determine if targets (precipitation, wind, etc.) are moving towards or away from the radar station.
🎓 Doppler Effect = frequency change. Moving towards radar = higher frequency (blue shift). Moving away = lower frequency (red shift). This principle also used in airborne weather radar for wind shear detection.
Q6. Bright Band is an indicator of:
(a) Strong/severe storm (b) CB cloud (c) Weak storm
(a) Strong/severe storm (b) CB cloud (c) Weak storm
✅ Correct Answer: (c) Weak storm
Bright Band is an indicator of a WEAK storm. It appears at the freezing level in stratiform precipitation (not convective). It disappears with increasing convection.
Bright Band is an indicator of a WEAK storm. It appears at the freezing level in stratiform precipitation (not convective). It disappears with increasing convection.
❌ (a) Strong/severe storm: This is the OPPOSITE — Bright Band = weak storm. ❌ (b) CB cloud: CB echoes have sharp edges and may extend to −40°C — no Bright Band. Bright Band = stratiform (flat, weak) precipitation.
🎓 Counter-intuitive DGCA trap! Bright Band = WEAK storm. Formed by melting snowflakes at the freezing level in stratiform rain. Disappears when convection (strong storm) develops.
Q7. A figure '6' echo is an indication of:
(a) Hailstorm (b) Tornado (c) Severe turbulence
(a) Hailstorm (b) Tornado (c) Severe turbulence
✅ Correct Answer: (b) Tornado
A radar echo of the figure '6' shape is an indication of a tornado. Hooks, Appendages and Protuberances indicate severe storms with hail.
A radar echo of the figure '6' shape is an indication of a tornado. Hooks, Appendages and Protuberances indicate severe storms with hail.
🎓 Figure '6' = Tornado on radar. This is because the hook-echo structure (associated with tornado supercells) resembles the number 6. Classic DGCA question.
Q8. Spiral bands on radar indicate:
(a) Severe TS (b) Tropical Cyclone (c) Hailstorm
(a) Severe TS (b) Tropical Cyclone (c) Hailstorm
✅ Correct Answer: (b) Tropical Cyclone
Spiral bands on radar indicate tropical cyclones and last for a long time.
Spiral bands on radar indicate tropical cyclones and last for a long time.
🎓 Spiral bands = TC signature. The spiral arms of precipitation are the classic visual structure of a tropical cyclone on radar imagery.
Q9. On airborne weather radar, Red/Magenta colour indicates:
(a) Light precipitation (b) Moderate precipitation (c) Heavy precipitation, TS, severe turbulence — AVOID
(a) Light precipitation (b) Moderate precipitation (c) Heavy precipitation, TS, severe turbulence — AVOID
✅ Correct Answer: (c) Heavy precipitation, TS, severe turbulence — aircraft should ALWAYS AVOID
Red/Magenta on airborne radar = heavy precipitation, TS, hail, strong winds, tornadoes, severe turbulence. Aircraft must always avoid these areas.
Red/Magenta on airborne radar = heavy precipitation, TS, hail, strong winds, tornadoes, severe turbulence. Aircraft must always avoid these areas.
🎓 Color code: Green=Go (light, 1–4mm), Yellow=Caution (moderate, 4–12mm), Red/Magenta=STOP/AVOID (severe, ≥12mm). Never penetrate Red/Magenta areas.
Q10. Geostationary satellites are placed at an altitude of approximately:
(a) 650–1500 km (b) 36,000 km (c) 500 km
(a) 650–1500 km (b) 36,000 km (c) 500 km
✅ Correct Answer: (b) 36,000 km
Geostationary satellites are placed in near circular orbit at about 36,000 km in the plane of the earth's equator. They are earth synchronized with same period of rotation as earth.
Geostationary satellites are placed in near circular orbit at about 36,000 km in the plane of the earth's equator. They are earth synchronized with same period of rotation as earth.
❌ (a) 650–1500 km: This is the altitude range for Polar Orbiting satellites. ❌ (c) 500 km: Too low — this would be LEO (Low Earth Orbit).
🎓 Geostationary = 36,000 km; 5 cover the globe; earth-synchronized. Polar = 650–1500 km; covers earth twice/day; same spot every 12 hr.
Q11. How many geostationary satellites are needed to cover the entire globe?
(a) 3 (b) 4 (c) 5
(a) 3 (b) 4 (c) 5
✅ Correct Answer: (c) 5
Five geostationary satellites are capable of covering the entire globe. METEOSAT, INSAT, GMS, and GOES (2) together provide global geostationary coverage.
Five geostationary satellites are capable of covering the entire globe. METEOSAT, INSAT, GMS, and GOES (2) together provide global geostationary coverage.
🎓 5 geostationary satellites = global coverage. NOAA provides polar (LEO) global coverage with fewer satellites but periodic, not continuous, coverage.
Q12. Kalpana-1 satellite is located at:
(a) 74°E (b) 93.5°E (c) 82°E
(a) 74°E (b) 93.5°E (c) 82°E
✅ Correct Answer: (a) 74°E
Kalpana-1 was launched on 12 September 2002 and is located at 74°E. INSAT-3A is at 93.5°E. INSAT-3D is at 82°E.
Kalpana-1 was launched on 12 September 2002 and is located at 74°E. INSAT-3A is at 93.5°E. INSAT-3D is at 82°E.
🎓 Satellite positions: Kalpana-1 = 74°E; INSAT-3A = 93.5°E; INSAT-3D = 82°E; INSAT-3DR = 74°E (same as Kalpana-1). GMS (Japan) = 130°E.
Q13. In IR satellite imagery, the lowest temperatures appear:
(a) Black (b) Dark grey (c) White (brightest)
(a) Black (b) Dark grey (c) White (brightest)
✅ Correct Answer: (c) White (brightest)
In IR images, the lowest temperatures (highest, coldest cloud tops) are the whitest (brightest). The warmest areas appear dark grey or black.
In IR images, the lowest temperatures (highest, coldest cloud tops) are the whitest (brightest). The warmest areas appear dark grey or black.
🎓 IR imagery rule: COLD = WHITE = High clouds. WARM = BLACK/DARK = Surface/warm areas. Useful for identifying deep convection (appears bright white in IR).
Q14. Drizzle does not show up on radar because radar returns are proportional to:
(a) Square of droplet diameter (b) Fourth power of droplet diameter (c) Sixth power of droplet diameter
(a) Square of droplet diameter (b) Fourth power of droplet diameter (c) Sixth power of droplet diameter
✅ Correct Answer: (c) Sixth power of droplet diameter
Radar returns are proportional to the sixth power of droplet diameter. Since drizzle droplets are very small, their sixth power is tiny — making them virtually invisible to radar.
Radar returns are proportional to the sixth power of droplet diameter. Since drizzle droplets are very small, their sixth power is tiny — making them virtually invisible to radar.
🎓 Z = D⁶ (Z is radar reflectivity, D is droplet diameter). Sixth power means a tiny change in size = massive change in reflectivity. Drizzle droplets too small = near zero radar return.
Q15. INSAT-3D was launched from:
(a) Sriharikota (b) Baikonur (c) French Guiana Space Centre
(a) Sriharikota (b) Baikonur (c) French Guiana Space Centre
✅ Correct Answer: (c) French Guiana Space Centre
INSAT-3D was launched on 25 July 2013 from French Guiana Space Centre (Ariane launch site). It is an advanced weather satellite for operational, environmental and storm warning.
INSAT-3D was launched on 25 July 2013 from French Guiana Space Centre (Ariane launch site). It is an advanced weather satellite for operational, environmental and storm warning.
🎓 INSAT-3D = French Guiana Space Centre, 25 Jul 2013, at 82°E. INSAT-3DR = launched 08 Sep 2016 at 74°E. Both are operational Met satellites.
Master Reference Tables
Radar Band Summary
| Band | Wavelength | Use |
|---|---|---|
| K Band | 0.75–2.5 cm | Cloud detection |
| X Band | 2.5–4 cm | Storm detection; airborne WXR (~3 cm) |
| C Band | 4–8 cm | — |
| S Band | 8–15 cm | Rain, precipitation, cyclones, depressions; Quantitative radar ~10 cm |
| L Band | 15–30 cm | Long range |
Radar Echo Significance
| Echo Type | Significance |
|---|---|
| Bright Band | WEAK storm; freezing level; stratiform; a few hundred metres thick |
| Figure '6' echo | TORNADO |
| Spiral bands | Tropical Cyclone |
| Hook/Protuberance | Severe storm with hail |
| Dry Holes | Severe storm — strong winds + heavy rain |
| Converging echoes | Severe storm |
| CB echo (top at −40°C) | Cumulonimbus |
| Slant vertical columns | Vertical wind shear |
| Separate rain columns | Wind shear in TS |
Indian Satellite Summary
| Satellite | Launch | Position | Resolution (VIS/IR/WV) |
|---|---|---|---|
| Kalpana-1 | 12 Sep 2002 | 74°E | 2×2 km / — / 8×8 km |
| INSAT-3A | 10 Apr 2003 | 93.5°E | 1×1 km (CCD) |
| INSAT-3D | 25 Jul 2013 | 82°E | 1 km / 4 km / 8 km |
| INSAT-3DR | 08 Sep 2016 | 74°E | 1 km / 4 km / 8 km |
Mnemonics
| Mnemonic | Meaning |
|---|---|
| "PPI = Plan, RHI = Height" | PPI gives plan view; RHI gives altitude of CB cells |
| "S = Sea/Cyclone, X = Storm, K = Clouds" | Radar band applications |
| "Bright Band = Weak" | Counter-intuitive — Bright Band = weak/stratiform storm |
| "6 = Tornado" | Figure '6' radar echo = tornado indication |
| "Green Go, Yellow Caution, Red/Magenta STOP" | Airborne radar color action rule |
| "Cold = White (IR)" | In IR imagery, coldest (highest) clouds appear whitest |
| "5 Geosats cover globe" | Five geostationary satellites = global coverage |
| "36,000 km Geo, 650–1500 Polar" | Satellite altitude quick reference |