15
METEOROLOGY — CHAPTER 15 · NOTES
Jet Streams
by Ghost Aviator
LECTURE PARTS
Table of Contents
- 1. Definition & Basic Properties
- 2. Types of Jet Streams
- 3. Sub-tropical Jet Stream (STJ) over India
- 4. Temperature Distribution & Wind Shear
- 5. STJ and Weather
- 6. Tropical Jet Stream (TJ)
- 7. Low Level Jets (LLJ)
- 8. Cause, Clouds & CAT associated with Jetstream
- 9. Quick Revision Summary
- 10. Practice Q&A
- 11. Master Reference Tables
1. Definition & Basic Properties
Jet Stream: A strong narrow current of winds along a semi-horizontal axis in the upper troposphere. Jet streams are present in both hemispheres all year round. The path of a jet stream is zigzag wavy like a serpentine.
- Length: thousands of km
- Width: hundreds of km
- Depth: some km (often less than 5 km)
- Vertical Wind Shear: about 5 m/s per km
- Arbitrary lower limit of jet core velocity: 30 m/sec (60 kt)
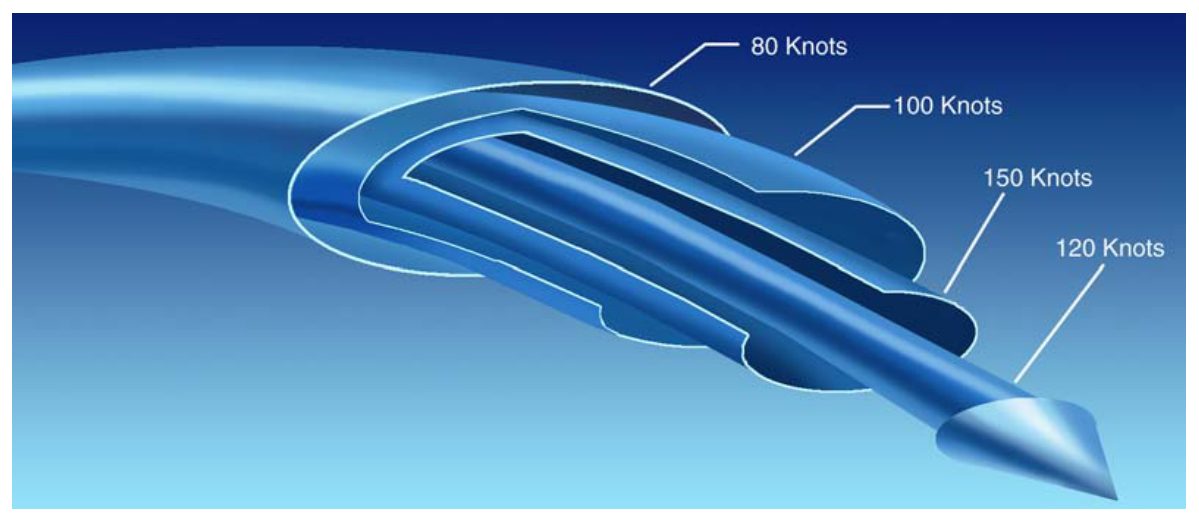
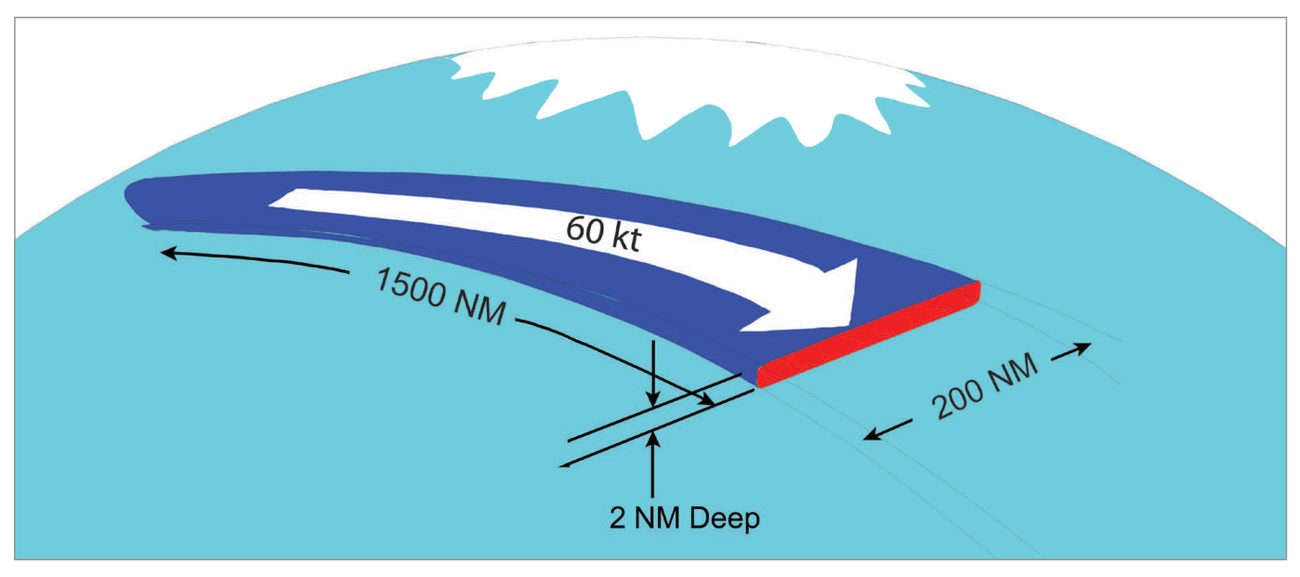
Jet Streaks (Wind Maxima): Along the axis of a jet stream there are centres of high speed winds called Jet Streaks — wind maxima. Weaker winds lie in between. Jet streaks retain their strength but move slower (by up to 25 kt) than the jet stream itself. In a wavy jet they are located over or near the ridge.
Wind speed along the axis is NOT always uniform. At certain places the wind speed reduces below 60 kt → constituting breaks in the jet stream. Sometimes jet streams split into two or more parts, combine, or flow in different directions.
Wind speed along the axis is NOT always uniform. At certain places the wind speed reduces below 60 kt → constituting breaks in the jet stream. Sometimes jet streams split into two or more parts, combine, or flow in different directions.
🧠 Path of maximum speed = the CORE (axis) of the jet stream.
Jet Streaks = centres of high wind speed along the axis, located over/near ridges in wavy jets.
Jet Streaks = centres of high wind speed along the axis, located over/near ridges in wavy jets.
2. Types of Jet Streams
There are four types of jet streams in the troposphere:
| Type | Symbol | Direction | Height / Pressure | Key Features |
|---|---|---|---|---|
| Arctic Jet Stream | AJ | Westerly | 7–8 km, near polar tropopause | Over Arctic region, close to polar tropopause |
| Polar Front Jet | PFJ | Westerly (mainly); NWly or SWly on occasions | ~250 hPa, 9–12 km (30,000–39,000 ft) | Also called mid-latitude jet. N America, Europe, Asia; SH = circles Antarctica. Migrates: winter → 30°N; summer → 60°N. Normal speed: 80–100 kt in winters. |
| Sub-tropical Jet | STJ | Westerly | 10–16 km, near mid-latitude tropopause break | Above subtropical high pressure belt. Winter position: S of 22°N; Summer: N of 35°N (weakens). Affects India: Oct–May. Speed: 100–215 kt (up to 398 km/h). |
| Tropical Jet Stream | TJ | Easterly | ~15–16 km, ~150 hPa | Also called Easterly Jet Stream. Prominent during monsoons, weak in winters. Speed: 60–80 kt avg; max 150 kt. Axis at 13°N (Chennai lat.) over India in Jul–Aug. Only over Asia and Africa. NOT over Atlantic and Pacific. |
| Stratospheric Jet | SJ | Westerly (winter) / Easterly (summer) | Above 20 km | In Arctic and Antarctic regions. Westerlies in winter; easterlies in summer. |
flowchart TB
  JS[JET STREAMS\nUpper Troposphere]
  JS --> AJ[Arctic Jet AJ\n7-8 km\nWesterly\nPolar regions]
  JS --> PFJ[Polar Front Jet PFJ\n9-12 km / 250 hPa\nWesterly\n30N winter → 60N summer\n80-100 kt]
  JS --> STJ[Sub-tropical Jet STJ\n10-16 km\nWESTERLY\n22N winter → 35N summer\n100-215 kt\nAffects India Oct-May]
  JS --> TJ[Tropical Jet TJ\n15-16 km / 150 hPa\nEASTERLY\nAxis 13N over India\nJun-Aug\nOnly Asia+Africa]
  JS --> SJ[Stratospheric Jet SJ\nAbove 20 km\nArctic/Antarctic regions]
3. Sub-tropical Jet Stream (STJ) over India
STJ seasonal movement over India:
- Appears over N India in October after withdrawal of monsoon
- Progressively shifts southwards as winter progresses
- Mean position: roughly at 27°N at height of 12 km
- Reaches southernmost position at 22°N in February
- Prevails over Indian subcontinent for about 8 months (Oct to May)
- After May: shifts northwards and moves out of Indian subcontinent
STJ wind speeds over India:
- Mean wind speed: 100 kt
- Maximum: 200 kt
- Lowest (Oct and May): 60–70 kt
- Highest (January): 100–120 kt; on occasions core reaches 200 kt
- Higher speeds more common in January and February than December
- Level of maximum wind: a few km below the tropopause
STJ structure:
- STJ splits due to Himalayas → one branch south, one north of Himalayas → recombine over China
- STJ has a layered structure: often two layers of maximum wind to the S of the jet core
- Jet stream strengthens by 10–15 kt downstream, along axis from Jodhpur to Guwahati
- STJ located 3–4 km below the tropopause in region where there is a break in tropical and middle tropopause at 300–200 hPa
🧠 STJ positions at a glance:
Oct (arrival, 27°N, 12 km) → Feb (southernmost, 22°N) → May (exit northwards) → ABSENT Jun–Sep (monsoon season, TJ takes over)
Oct (arrival, 27°N, 12 km) → Feb (southernmost, 22°N) → May (exit northwards) → ABSENT Jun–Sep (monsoon season, TJ takes over)
4. Temperature Distribution & Wind Shear
STJ is caused by a concentration of horizontal temperature gradient below the jet and reversal above it.
- Surface to 300 hPa: horizontal temperature gradient from S to N (particularly at 500 and 300 hPa) → thermal wind builds up → jet maxima reached at 200 hPa
- At 200 hPa: thermal gradient is slack and thereafter reverses
- Lapse rates more to the S of the jetstream than to the N and above and below.
- Near the STJ: temperature gradient is very small or negligible
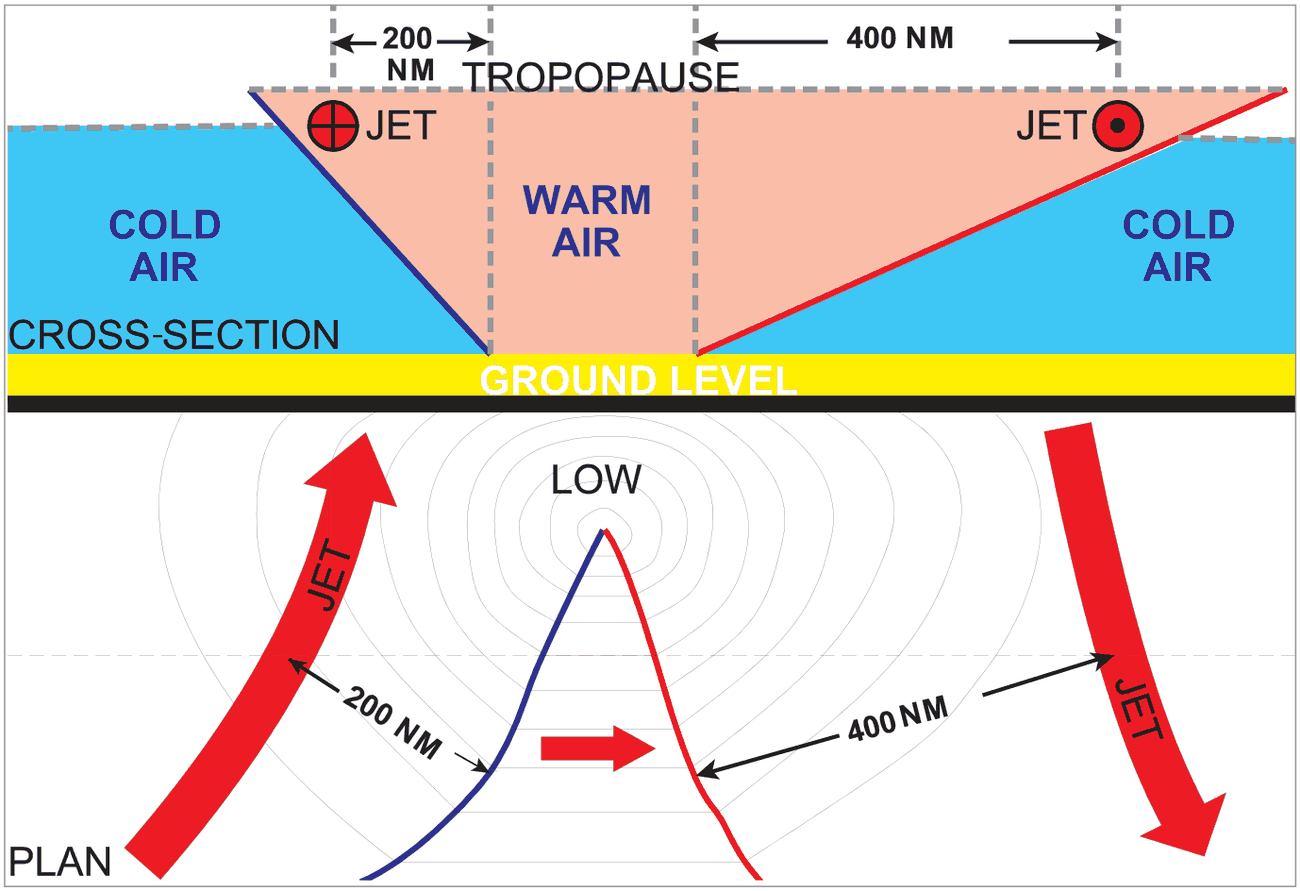
Vertical shear: Wind speed changes rapidly above and below the jet core. For aviation hazards, distinguish this wind-speed profile from the location of strongest clear-air turbulence (CAT): a common CAT region is near or just below the core on the cold-air side, with a secondary region above.
Horizontal Shear: In STJ, horizontal shear is more to the north than to the south of the jet core.
- At core level: winds weaken by about 35 kt/100 NM to the south
- North side of front is steeper: about 100 kt/100 NM
- Shear is more below the core and to the north (left looking downstream)
5. STJ and Weather
With the passage of a WD, STJ strengthens (130–150 kt) and moves south. Divergence in the left entrance and right exit of the jet core in combination with south → a low level system (low pressure) enhances its activity → may cause severe TS.
flowchart LR
  A[WD passes] --> B[STJ strengthens\n130-150 kt]
  B --> C[STJ moves south]
  C --> D[Divergence in left entrance\n+ right exit of jet core]
  D --> E[Low level system\nlow pressure enhanced]
  E --> F[SEVERE TS possible]
6. Tropical Jet Stream (TJ)
Also called: Easterly Jet Stream.
- Strong Easterlies blow to the S of 25°N at 100 hPa during monsoon
- Found only over Asia and Africa; NOT over Atlantic and Pacific
- During monsoon: 10–20 kt Ely winds at 300 hPa, S of 27°N and Wly to N
- Prominent during monsoons; becomes very weak in winters
- Average core speed: 60–80 kt; maximum: 150 kt
- TJ seen over India: June to August; disappears by September
- Axis: 13°N (near Chennai/Madras latitude), at 150 hPa, 15–16 km height
- Level of maximum wind: just below the tropopause
- Wind shears in TJ much less than STJ
Cause of TJ: Due to sun being N of 20°N in summer → southward decrease of temperature throughout the troposphere → affects the 20°N Tibetan Plateau. The Tibetan Plateau (being south in summers) causes lower level westerlies to change to easterlies above 500 hPa. Easterlies strengthen with height up to 16 km.
🧠 TJ vs STJ:
STJ = Westerly = Oct–May = 22–27°N = 12 km = 100–200 kt (strong)
TJ = Easterly = Jun–Aug = 13°N = 15–16 km = 60–150 kt (monsoon jet)
TJ = only Asia + Africa. STJ = global.
STJ = Westerly = Oct–May = 22–27°N = 12 km = 100–200 kt (strong)
TJ = Easterly = Jun–Aug = 13°N = 15–16 km = 60–150 kt (monsoon jet)
TJ = only Asia + Africa. STJ = global.
7. Low Level Jets (LLJ)
Very strong winds appear in the lower levels, between 1 km and 3 km at many places in the sub-tropics. These are called Low Level Jets (LLJ).
A prominent LLJ is noticed over the Indian Peninsula during SW monsoon when low level winds become very strong. This LLJ is probably a continuation of the jet stream off the Somalia Coast in Africa. The LLJ enhances the monsoon activity over the Indian Peninsula.
A prominent LLJ is noticed over the Indian Peninsula during SW monsoon when low level winds become very strong. This LLJ is probably a continuation of the jet stream off the Somalia Coast in Africa. The LLJ enhances the monsoon activity over the Indian Peninsula.
8. Cause, Clouds & CAT associated with Jetstream
Cause
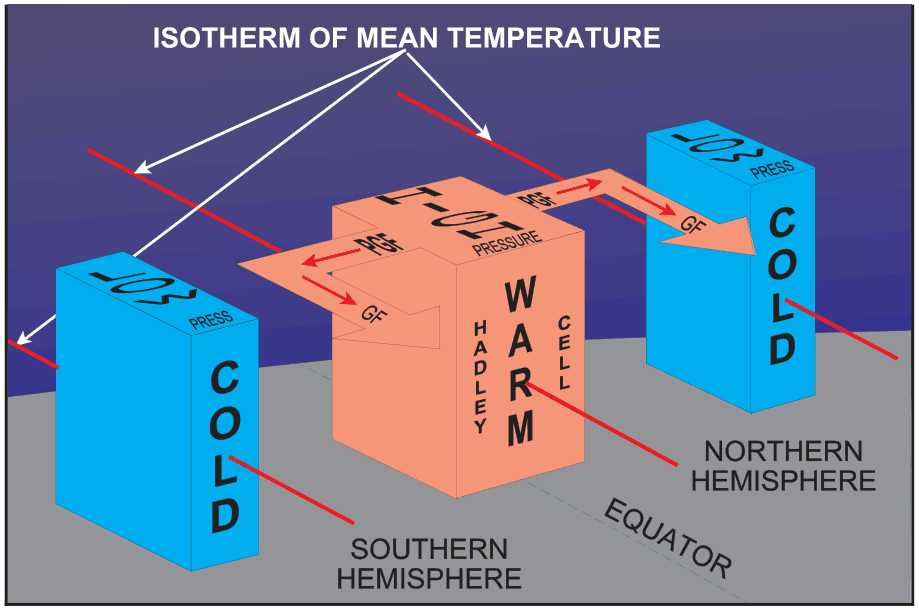
Jetstream is caused by the large horizontal temperature gradient. The larger the temperature difference between two air masses, the stronger is the jet stream.
Clouds Associated with Jetstream
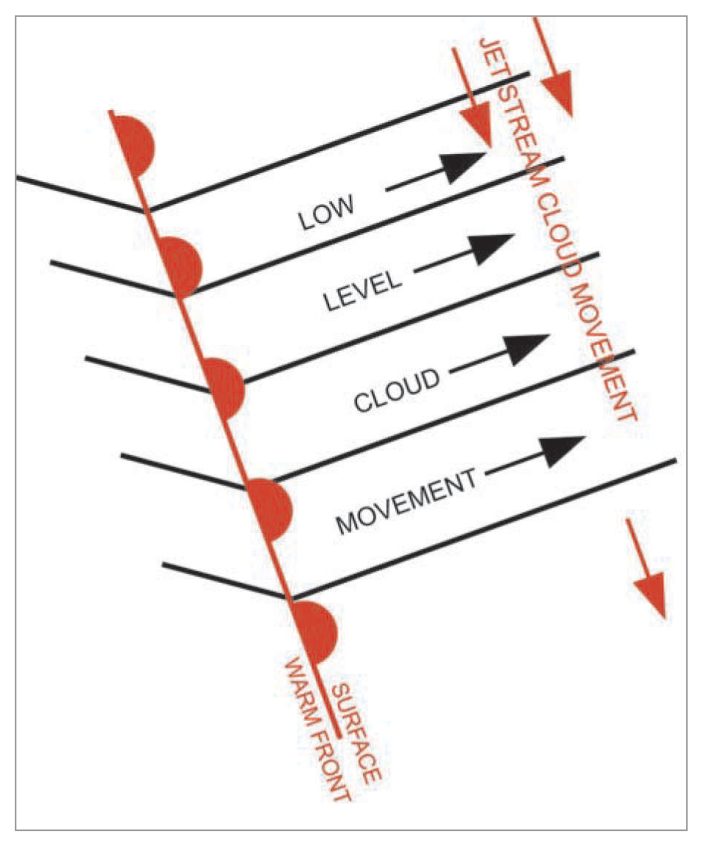
- Extensive sheets of high clouds on the warm side, with sharply defined edges parallel to the jet axis
- Ci clouds more common on the cold side
- CC clouds on the cold side — tops invariably just below the tropopause
- Warm side cloud tops: a few thousand feet below the tropopause
- Roll type of Ci or CS may be seen along the length
- Where moisture is less: thin layer of haze on the warm side; clear on the cold side
Clear Air Turbulence (CAT)
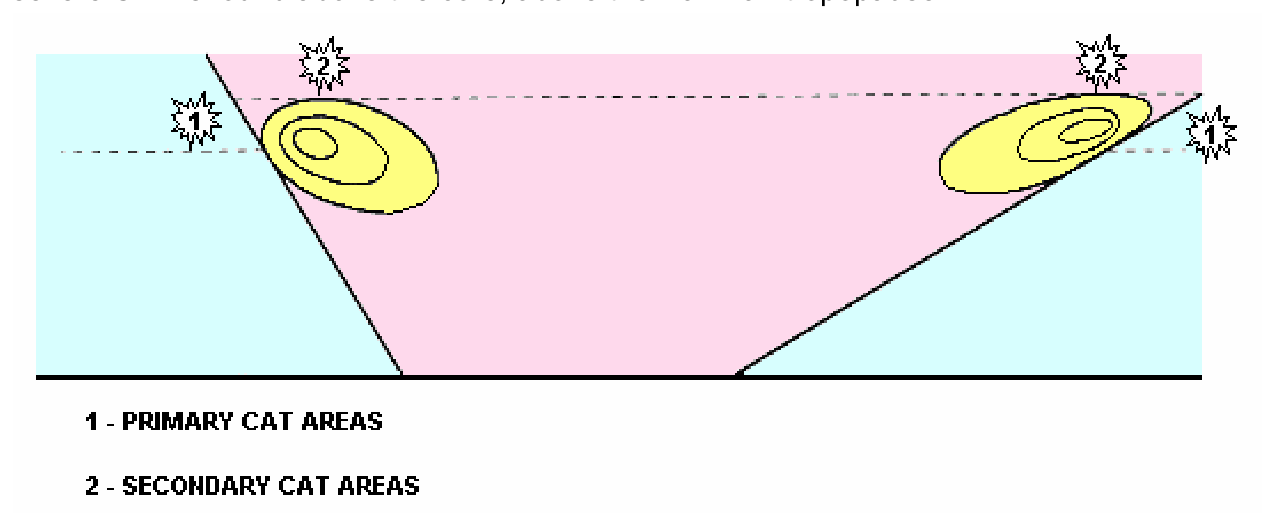
CAT occurs around boundaries of Jetstream due to large vertical and horizontal wind shear. Also more in a developing and rapidly moving jet.
⚠️ Strongest CAT occurs near or just below the axis on the COLDER (low pressure) side, with a secondary maxima above the Jetstream.
Looking downstream: CAT is to the LEFT in the Northern Hemisphere; to the right in Southern Hemisphere.
Looking downstream: CAT is to the LEFT in the Northern Hemisphere; to the right in Southern Hemisphere.
CAT in a jetstream is most severe in:
- Strong Winds
- Curved Jets — the sharper the curve, the stronger the turbulence
- On the leeward side and above mountain ranges
🧠 CAT location mnemonic: "Left of jet = Worst CAT" (Northern Hemisphere, looking downstream = cold/low pressure side). Pilot tip: if encountering CAT near jet, move to the RIGHT (warm side) when looking downstream.
9. Quick Revision Summary
⚡ AMBER Quick Revision — Jet Streams
- Jet stream lower limit: 30 m/sec = 60 kt (WMO arbitrary lower limit)
- Vertical WS: 5 m/s per km | Depth often <5 km
- Jet Streaks: centres of high wind along axis; located over/near RIDGE in wavy jet; move slower than jet by up to 25 kt
- Path of maximum speed = CORE (Axis)
- 5 types: Arctic (AJ), Polar Front (PFJ), Sub-tropical (STJ), Tropical (TJ), Stratospheric (SJ)
- STJ = Westerly; TJ = Easterly (key distinction)
- STJ over India: Oct (27°N, 12 km) → Feb (22°N, southernmost) → May exit | Mean 100 kt, Max 200 kt | Splits at Himalayas
- STJ structure: Two layers of max wind to the S of jet core | Strengthens 10–15 kt downstream (Jodhpur → Guwahati)
- STJ + WD: STJ strengthens to 130–150 kt + moves south → severe TS possible
- TJ: Easterly; Jun–Aug; 13°N (Chennai lat.); 15–16 km; 150 hPa; 60–80 kt (max 150 kt); only Asia + Africa; disappears by September
- LLJ: 1–3 km; SW monsoon; Somalia Coast origin; enhances monsoon over India
- CAT strongest: below axis on COLD side (left in NH); in strong winds, curved jets, leeward of mountains
- Vertical shear: Strong changes occur above and below the core. CAT is commonly strongest near or just below the cold-air side of the axis.
- Horizontal shear: More to the NORTH (left) of the jet
- Clouds: High clouds on WARM side; Ci more on COLD side
10. Practice Q&A
Q1. The arbitrary lower limit of jet core velocity has been assigned by WMO as:
(a) 60 kt (b) 60 m/s (c) 70 m/s
(a) 60 kt (b) 60 m/s (c) 70 m/s
✅ Answer: (a) 60 kt — The WMO lower limit of jet core speed is 60 kt, which is 30 m/s. Anything slower is not classed as a jet stream.
❌ (b) 60 m/s would be about 117 kt, far above the minimum. (c) 70 m/s is higher still.
💡 Jet stream: at least 60 kt (30 m/s).
Q2. Jet stream has:
(a) one maxima (b) one or more maxima (c) only two maxima
(a) one maxima (b) one or more maxima (c) only two maxima
✅ Answer: (b) one or more maxima — The wind speed along a jet axis is not uniform: there are one or more maxima, called jet streaks.
❌ (a) and (c) set a fixed number of maxima, which the jet does not have.
💡 Jet streaks = the fast patches along the axis.
Q3. The vertical wind shear in a jet stream is:
(a) 5 m/sec/km (b) 6 m/sec/km (c) 4 m/sec/km
(a) 5 m/sec/km (b) 6 m/sec/km (c) 4 m/sec/km
✅ Answer: (a) 5 m/sec/km — The text states: "The vertical WS is about 5 m/s per km." This is the key defining vertical wind shear value for jet streams.
❌ (b) 6 m/sec/km — not the stated value. ❌ (c) 4 m/sec/km — not the stated value.
💡 Jet stream vertical WS = 5 m/s per km. Memorise this for DGCA.
Q5. In a jet stream, the path of maximum speed is known as: (a) Core (b) Axis (c) Jet streak
✅ Answer: (b) Axis — The line along which the speed is greatest is the jet axis. The tube of fast air surrounding it is the core.
❌ (a) The core is the tubular volume around the axis. (c) A jet streak is a local maximum of speed along the axis.
💡 Axis = the path. Core = the tube. Streak = a fast patch.
Q6. Wind speed along the axis of a jet stream is always:
(a) same (b) uniform (c) not uniform
(a) same (b) uniform (c) not uniform
✅ Answer: (c) not uniform — The text explicitly states: "The wind speed along the axis is not always uniform. There are distinct maxima along the axis."
❌ (a)(b) Uniform/same — incorrect; jet streaks create distinct speed maxima along the axis.
💡 Jet speed = NOT uniform along the axis. Jet streaks create local maxima. Breaks occur where speed falls below 60 kt.
Q7. Along the axis of a jet stream there are centres of high speed winds, these are called:
(a) Ridge (b) Jet streaks (c) Between Trough and Ridge
(a) Ridge (b) Jet streaks (c) Between Trough and Ridge
✅ Answer: (b) Jet streaks — Centres of high speed wind along the jet axis = Jet Streaks (wind maxima). In a wavy jet, these are located over or near the ridge.
❌ (a) Ridge: the location of jet streaks in a wavy jet, not the name of the centres. ❌ (c) Not the correct terminology.
💡 Jet Streaks = wind maxima along jet axis. Located over/near ridges in wavy jets.
Q8. Sub-tropical Jet Stream (STJ) is:
(a) Westerly (b) Easterly (c) Southerly
(a) Westerly (b) Easterly (c) Southerly
✅ Answer: (a) Westerly — The sub-tropical jet stream is a westerly jet. The tropical jet stream is the easterly one.
❌ (b) Easterly describes the Tropical Jet Stream (TJ), not the STJ. (c) Southerly is not a jet stream direction.
💡 STJ = westerly. TJ = easterly. Do not mix them.
Q11. The southern most position of STJ is in February:
(a) 22°N (b) 13°N (c) 17°N
(a) 22°N (b) 13°N (c) 17°N
✅ Answer: (a) 22°N — The text states: "It reaches its southern most position of 22°N in February."
❌ (b) 13°N: this is the latitude of the Tropical Jet Stream axis, not the STJ. ❌ (c) 17°N: not the stated value.
💡 STJ southernmost = 22°N in February. TJ axis = 13°N (Chennai). Don't mix these up!
Q12. The STJ affects India from:
(a) Oct to May (b) Sep to Oct (c) Jun to Sep
(a) Oct to May (b) Sep to Oct (c) Jun to Sep
✅ Answer: (a) Oct to May — STJ prevails over the Indian subcontinent for about 8 months from October to May. After May it shifts northwards and exits the Indian subcontinent.
❌ (b) Sep–Oct: too short; STJ arrives in October and stays till May. ❌ (c) Jun–Sep: this is the monsoon period when TJ (Easterly jet) prevails — STJ is absent then.
💡 STJ = Oct to May (8 months, non-monsoon). TJ = Jun to Aug (monsoon). When one is present, the other is absent over India.
Q13. STJ has a layered structure. There are often two layers of max wind to the … of jet core:
(a) S (b) N (c) SW
(a) S (b) N (c) SW
✅ Answer: (a) S — The text states: "There are often two layers of maximum wind, to the S of the jet core." This is the layered structure of the STJ.
❌ (b) N: horizontal shear is more to the N, but the two layers of max wind are to the S. ❌ (c) SW: not the stated direction.
💡 Two layers of max wind in STJ = to the SOUTH of jet core. Horizontal shear strongest = to the NORTH of jet core.
Q14. The STJ strengthens:
(a) Northwards (b) Upstream (c) Downstream
(a) Northwards (b) Upstream (c) Downstream
✅ Answer: (c) Downstream — "The jet stream strengthens by 10–15 kt downstream, along the axis from Jodhpur to Guwahati."
❌ (a) Northwards: lateral direction, not along jet axis. ❌ (b) Upstream: opposite of the text — weakens upstream, strengthens downstream.
💡 STJ strengthens DOWNSTREAM (W to E): Jodhpur → Guwahati, by 10–15 kt. This helps forecasters — stronger STJ = more active weather over E India.
Q15. At and near the STJ the temperature gradient is very:
(a) Small (b) Large (c) Moderate
(a) Small (b) Large (c) Moderate
✅ Answer: (a) Small — "Near the STJ the temperature gradient is very small or negligible." The strong gradient exists BELOW the jet (up to 300 hPa); it weakens at the jet level and reverses above.
❌ (b) Large: the large gradient is BELOW the jet (causes the jet), not AT the jet level. ❌ (c) Moderate: the text says "very small or negligible."
💡 Temperature gradient: large BELOW jet (causes it) → very small/negligible AT jet level → reverses ABOVE jet. This is key to understanding jet stream physics.
Q16. Vertical wind shear in STJ is greater:
(a) below (b) above (c) same above and below
(a) below (b) above (c) same above and below
✅ Answer: (a) below — The greatest vertical wind shear lies just below the jet core, on the cold-air side, with a secondary area of shear above the core.
❌ (b) Above: the secondary area above the core is weaker. (c) The shear is not the same above and below.
💡 CAT is worst just below the core on the cold side, with a secondary zone above it.
Q17. TJ prevails over Indian Peninsula from:
(a) May to Jun (b) Jun to Aug (c) Sep to Oct
(a) May to Jun (b) Jun to Aug (c) Sep to Oct
✅ Answer: (b) Jun to Aug — The TJ (Easterly Jet Stream) is seen over India from June to August and disappears by September.
❌ (a) May–Jun: too early; TJ develops with monsoon onset in June. ❌ (c) Sep–Oct: TJ disappears by September; STJ returns in October.
💡 TJ = Jun → Aug → disappears Sep. STJ returns Oct. Perfect seasonal exchange over India.
Q18. TJ is located over India approximately at a height of:
(a) 11–12 km (b) 15–16 km (c) 8–10 km
(a) 11–12 km (b) 15–16 km (c) 8–10 km
✅ Answer: (b) 15–16 km — The text states: "It is at a mean height of about 15 to 16 km... The axis in July-August is near latitude 13°N (Chennai Lat.), at 150 hPa, over India."
❌ (a) 11–12 km: this is the height of the STJ (Sub-tropical Jet, at ~12 km). ❌ (c) 8–10 km: too low for a jet stream; PFJ is at 9–12 km.
💡 TJ height = 15–16 km at 150 hPa. STJ height = ~12 km. Don't mix heights!
Q19. TJ is located over India approximately at a height of 15–16 km. It is in:
(a) July–Aug (b) Sep–Oct (c) Jun
(a) July–Aug (b) Sep–Oct (c) Jun
✅ Answer: (a) July–August — "The axis in July-August is near latitude 13°N (Chennai Lat.), at 150 hPa." The TJ is active June–August but at maximum strength in July–August.
❌ (b) Sep–Oct: TJ disappears by Sep; STJ returns Oct. ❌ (c) Jun only: TJ starts in June but the axis specification is for Jul–Aug.
💡 TJ axis position (13°N, 15–16 km) is specified for July–August — peak monsoon period.
Q20. In the TJ the wind shears are much less than the STJ:
(a) True (b) False
(a) True (b) False
✅ Answer: (a) True — The text states: "In the TJ the wind shears are much less than the STJ." The STJ has much stronger associated wind shears (and therefore stronger CAT potential) than the TJ.
❌ False: the text explicitly confirms TJ wind shears are less than STJ.
💡 TJ wind shear < STJ wind shear → Less CAT in TJ than STJ. The STJ is the more hazardous jet for aviation turbulence.
Q21. A jet stream can be recognised by: (a) High level dart (b) High Pressure (c) Streaks of Ci Lenticular clouds
✅ Answer: (c) Streaks of Ci Lenticular clouds — A jet stream shows up as long streaks and sheets of cirrus lined up along the axis.
❌ (a) and (b) do not identify a jet stream.
💡 Jet: streaky Ci along the axis.
Q22. Flying at and near the STJ the aircraft will experience: (a) Wind from right (b) Increasing tail wind
✅ Answer: (b) Increasing tail wind — The sub-tropical jet is a westerly jet, so an aircraft flying along it with the flow (eastbound) gets an increasing tail wind.
❌ (a) Wind from the right applies to a track across the jet, not along it.
💡 Along the STJ eastbound: tail wind. Westbound: head wind.
Q23. Strongest CAT occurs near the jetstream on the:
(a) Warm side (b) Cold side (low pressure side) (c) On the jet axis itself
(a) Warm side (b) Cold side (low pressure side) (c) On the jet axis itself
✅ Answer: (b) Cold side (low pressure side) — "Strongest CAT occurs near or just below the axis on colder (low pressure) side with a secondary maxima above the Jetstream." In the NH, this is to the LEFT looking downstream.
❌ (a) Warm side: some CAT but less severe. ❌ (c) On axis: maximum wind but not necessarily maximum CAT; shear zones are above/below and to the cold side.
💡 Strongest CAT = just below axis on COLD/LEFT side (NH). Secondary maximum = above the jet. Safest approach = from the warm/right side.
Q25. When and where tropical jet stream occurs: (a) All year along India (b) High level dart (c) In summers over SE Asia and Central Africa
✅ Answer: (c) In summers over SE Asia and Central Africa — The tropical (easterly) jet stream occurs in the summer monsoon months over Asia and Africa only, not over the Atlantic or the Pacific.
❌ (a) It is seasonal, not all year. (b) is not a place or season.
💡 TJ: June to August, Asia and Africa, easterly.
11. Master Reference Tables
All Numerical Values — Chapter 15
| Parameter | Value |
|---|---|
| WMO lower limit of jet stream velocity | 30 m/sec = 60 kt |
| Jet stream vertical WS | 5 m/s per km |
| Jet stream depth | Often less than 5 km |
| Jet streak moves slower than jet by | Up to 25 kt |
| PFJ height/pressure | ~250 hPa, 9–12 km (30,000–39,000 ft) |
| PFJ normal speeds in winter | 80–100 kt |
| PFJ winter migration | 30°N |
| PFJ summer migration | 60°N |
| STJ height | 10–16 km |
| STJ mean position over India | 27°N, 12 km |
| STJ southernmost position | 22°N in February |
| STJ northward exit (summer) | North of 35°N |
| STJ affects India (duration) | 8 months: Oct to May |
| STJ mean wind speed over India | 100 kt |
| STJ maximum wind speed | 200 kt |
| STJ lowest speeds (Oct and May) | 60–70 kt |
| STJ highest speeds (January) | 100–120 kt |
| STJ speed range overall | 100 to over 215 kt (398 km/h) |
| STJ level in tropopause region | 3–4 km below tropopause; 300–200 hPa |
| STJ strengthens downstream by | 10–15 kt (Jodhpur to Guwahati) |
| STJ strengthens with WD to | 130–150 kt |
| STJ horizontal shear (north side) | About 100 kt/100 NM |
| STJ horizontal shear (south side) | About 35 kt/100 NM |
| TJ height over India | 15–16 km |
| TJ pressure level | 150 hPa |
| TJ axis latitude over India (Jul–Aug) | 13°N (Chennai latitude) |
| TJ average core speed | 60–80 kt |
| TJ maximum speed | 150 kt |
| TJ active period over India | June to August |
| TJ disappears by | September |
| LLJ height | 1–3 km |
| Breaks in jet stream (speed falls below) | 60 kt |
| AJ height | 7–8 km |
| SJ height | Above 20 km |
Mnemonics
- Jet stream lower limit: "Thirty metres per second = Sixty knots = JET"
- STJ = W(esterly) / TJ = E(asterly) — "Sub-tropical jets WEST, Tropical jets EAST"
- STJ over India: "OCT-27N → FEB-22N → MAY-exit" (shifts south in winter)
- TJ = JAJA: June–August, Asia–Africa only
- STJ 8 months (Oct–May) vs TJ 3 months (Jun–Aug)
- Jet streaks: Over RIDGES in wavy jet; move slower than jet by up to 25 kt
- Strongest CAT = Cold side (LEFT in NH) just below jet axis
- Vertical wind shear: Strong above and below the core; distinguish the wind profile from the common CAT region near or below the cold-air side.
- STJ + WD = 130–150 kt + South shift → Severe TS
- LLJ = 1–3 km + Somalia origin + Enhances monsoon
- TJ axis over India = 13°N (Chennai) = 15–16 km = 150 hPa
- STJ axis over India = 27°N (mean) → 22°N (Feb southernmost) = 12 km
- CAT worst in: Strong winds + Curved jet + Leeward side of mountains
Ghost Aviator
Study Meteorology with other student pilots
Join the free Meteorology group on Telegram. Stuck on a doubt? Type /q and your question, and get an answer from Ghost Aviator's notes.
LIVE BATCH
Study Aviation Meteorology live with the Captain
Small batch of 10 · live doubt-clearing · 4–6 weeks · ₹12,999 ₹7,999
Previous
Ch.14: Air Masses, Fronts and Western Disturbances
Next
Ch.16: Clear Air Turbulence
Reinforce Chapter 15: Jet Streams
Test your knowledge and practice actual exam questions for Aviation Meteorology.
Planning your Pilot Training in 2026?
Calculate exact flying hours, DGCA exam fees, and living costs with our interactive calculator.